Corneal Edema... a.k.a. "Ultra Eye"...

Disclaimer: This article is not meant to be medical advice, a prescription, or a recommendation. Please consult your health care professional for specific strategies and medical advice tailored to you.

Corneal Edema in Ultra-Endurance Athletes: What You Need to Know

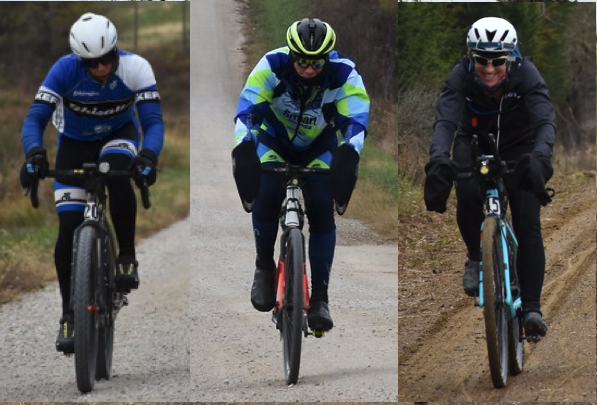
Corneal edema is a lesser-known yet significant issue that can affect athletes, particularly those engaged in ultra-endurance sports. This condition occurs when the cornea, the clear front surface of the eye, swells due to excess fluid buildup. Such swelling can blur vision and cause discomfort, potentially hindering performance in races or sporting events. It's not merely an inconvenience; corneal edema can substantially impair your ability to see, which is vital for any athlete. At T2M, our coaching group has observed athletes with corneal edema so severe that they've had to withdraw from races due to impaired vision. Symptoms can vary but often include blurred vision or halos around lights, and may extend to light sensitivity, visual distortion, watery eyes, eye pain or discomfort (some have no discomfort at all), or eye redness. In some instances, the cornea's cloudiness may be visible to others (see pictures below). Whether you're an ultramarathon runner, an ultra-cyclist on paved or gravel paths, or an enthusiast of long-distance challenges, understanding the potential impact of corneal edema is crucial for your eye health and your ability to complete your race or event.

The Delicate Balance of Corneal Hydration

The cornea itself needs to be maintained at a slightly lower hydration level relative to the rest of the eye to preserve clarity. Lacking blood vessels, it relies on the tear film in front and aqueous humor behind it for nourishment and waste removal. To maintain fluid balance, the cornea depends primarily on the endothelium, the back layer of the cornea. The endothelium provides both a barrier to keep excess fluid out and an active "pump" that moves bicarbonate ions out, with chloride ions, sodium ions, and water molecules following passively. This balance is critical; increased fluid within the cornea causes it to lose clarity, and vision can become temporarily severely compromised.

Challenges to Endothelial Function During Endurance Sports

During prolonged exercise, environmental factors such as wind, dust, or ultraviolet light may impair endothelial function, either allowing more fluid to enter the cornea or impairing the pumping action. Endothelial function can also be impacted by overall body hydration levels, oxygen levels, bicarbonate levels, lactate/glucose levels, electrolytes, and inflammatory signals, all of which can be influenced by exercise and nutrition. Furthermore, contact lenses may reduce oxygen availability to the cornea, and LASIK surgery may indirectly impact function by altering corneal depth/shape, contributing to additional risks for corneal edema.

The Role of the Tear Film 

The tear film is vital as it provides moisture, facilitates oxygen exchange with the cornea, and offers lubrication between the eyelid and the cornea. During prolonged exercise, there is an increased risk to the tear film, as windy, dry, and high-altitude environments lead to increased tear evaporation and decreased blink rates. This can contribute to tear film instability and dry spots on the cornea. Generally, the tear film is isotonic, meaning it neither adds nor removes moisture from the cornea. If it becomes hypertonic, it will draw moisture out of the cornea due to osmotic pressure. This can be beneficial if there is excess fluid in the cornea. Conversely, fluid will move into the cornea if the tear film becomes hypotonic, potentially exacerbating corneal edema.

Prevention and Management Strategies

Prevention is the best strategy; it's preferable to avoid problems rather than try to solve them during a race. To help prevent corneal edema, it's important to address factors that may negatively impact endothelial function. Wearing glasses at all times, with UV protection during the day and clear at night, can mitigate the effects of UV light and wind. Sealed glasses with side shields may further reduce the impact of dust or dirt. For those wearing contact lenses, understanding that some lenses can impede oxygen supply is important, and alternating with glasses during events may give your eyes a break. Staying adequately hydrated with a reasonable electrolyte balance is also vital for ensuring the endothelial pump functions well.

These are examples of sealed glasses available at the time of this article, but NOT specific recommendations (better and/or less expensive alternatives may be available). Glasses that seal around the skin can help reduce wind or dust impairment to the tear film.

Intervention for Corneal Edema During a Race

If prevention strategies are unsuccessful, some athletes have used hypertonic eye drops to manage corneal edema during a race. These drops, with a higher concentration of sodium/solutes, create an osmotic pressure that helps draw excess fluid out of the cornea, gradually restoring vision as fluid balance is reestablished. Hypertonic eye drops (5%) are often used as a short-term treatment for corneal edema from various causes, with good results and limited complications. At T2M, we’ve had an athlete successfully use hypertonic eye drops in a multi-day race after having symptoms (where the corneal clouding was observable), and the athlete was able to reverse the corneal edema, and went on to win the race. You need to consult an eye care professional before using these eye drops to ensure proper use and avoid potential negative side effects. Note that for mild cases of corneal edema, the drops may improve corneal edema within a few hours, but more severe cases may take longer to have results. It’s always best to consult your healthcare professional with questions.

Remember, prevention is key to avoiding critical fluid imbalances within the eye. Before even considering the use of hypertonic eye drops in a race (or any other situation), it is critical to talk to your medical professional to understand proper use and dosage and to prevent any potential short- or long-term damage to your eyes.

Disclaimer: This article is not meant to be medical advice, a prescription, or a recommendation. Please consult your healthcare professional for specific strategies and medical advice tailored to you.

Deep Dive - Additional resources / information:

1.     An investigation of Ultramarathon-Associated Visual Impairment.  This document describes a clouding of the eyes for some participants doing ultramarathon races.

2.     Slide presentation of the above paper.  This includes some good visuals, discussion of corneal edema, and even being able to create conditions in a lab replicating the condition.

3.     An article about the paper above, again with more graphics (pictures of affected eyes) and the potential use of hypertonic eye drops to help mitigate the situation. 

4.     Ultramarathon-Induced Bilateral Corneal Edema: A Case Report and Review of the Literature.  This article also discusses the potential of lactate accumulation as a potential cause as well (but still likely multifactorial).

5.     Corneal Opacity in a Participant of a 161-km Mountain Bike Race at High Altitude.  Another case study, describing corneal edema in the Leadville 100 race, including pictures of the cloudiness of the athlete’s eyes.

6.     Basic overview on endothelium.  A longer discussion, with more details on the “Leak” and “Pump” functions, is described in this paper, “Molecular Mechanisms Underlying the Corneal Endothelial Pump”.  A deep dive into how actate and bicarbonate can impact the pump in rabbit corneas is in a paper called, “Fluid transport by the cornea endothelium is dependent on buffering lactic acid efflux”. 

7.     Changes in the acid-base balance and lactate concentration in the blood in amateur ultramarathon runners during a 100-km run.  This paper discusses how lactate concentration changes over ultra-endurance running, which may be a contributing factor to corneal swelling, as discussed in the paper in point 6 above. 

8.     Evidence for the Major Contribution of Evaporation to Tear Film Thinning between Blinks – This paper concludes that there is a large reduction in tear thinning rate by wearing goggles, as it reduces the evaporation rate, which is a major cause of thinning between blinks.  This can be more of a factor if athletes are not blinking as often as normal during a race.  Goggles were shown to slow thinning, but these were using air-tight goggles… which likely are not practical in races.  That said, you “may” get benefits of lower evaporation (outside the scope of this paper) by reducing airflow across the eye, to help reduce evaporation rates somewhat (and the associated thinning of the tear film).

9.     In vivo assessment of mechanisms controlling corneal hydration.  This is an interesting paper looking at how quickly corneal edema subsided after it had been induced.  The summary indicated that during the recovery phase (when the edema was subsiding), the majority of the recovery was coming from evaporation from the tear film, rather than from the endothelial pump.  It was important to keep the eyes open to allow for evaporation, as opposed to recovering with the eyes closed (it took 2.5 hours to recover with eyes open and 4.0 with the eyes closed).  A “potential” solution here (outside this paper) is the using hypertonic eye drops to help facilitate removal of the excess corneal fluid, using the osmotic pressure/gradient.

10.  Review on the Use of Topical Ocular Hypertonic Saline in Corneal Edema.  A meta-analysis showing that hypertonic saline seems to be a safe and effective treatment for less severe forms of corneal edema, with limited complications (mild stinging/burning sensation reported).

11.  Safety and efficacy of hypertonic saline solution (5%) versus placebo in the treatment of postoperative corneal edema after uneventful phacoemulsification: a randomized double-blind study.  Although related to corneal edema related to surgery, this study showed 5% hypertonic saline solution to have a significant impact on corneal edema reduction, with no adverse effects found.


Heat Adaptation Training

Heat and humidity. Anyone who exercises in the heat knows it can have a significant negative impact on performance. Do you know you can train your body to perform better in the heat? Similar to training your muscles and cardiovascular system with exercise, or training your gut to process more calories for race day, we can also use heat adaptation protocols to improve our body’s response to hot conditions. This can put you at a significant advantage to your competition (or just make your exercise more productive and enjoyable), if your body is more heat adapted.

With the heat at the Olympics last year, there was a lot of discussion on the potential benefits of heat adaptation training (https://www.cbc.ca/amp/1.6090826? ). A particularly interesting article I came across recently was from Alex Hutchison, who does a great job of reviewing / interpreting studies. In this article (https://www.outsideonline.com/.../how-to-heat-proof-your.../) he discusses how a recent study demonstrated that doing heat-specific adaptation training, provided additional benefits beyond just training in the heat. The key point here is that simply training in hot weather may not provide as much benefit as specifically working on heat adaptation via a defined protocol (or in conjunction). He also covers that heat adaptation provides some benefits for as long as a month afterwards. So… you don’t have to do it all the time, but it may be good to do periodically, particularly in advance of key races where heat may be a factor (e.g. those of you doing Gravel Worlds coming up).

Do you know that while exercising, your core temperature rises? Besides ambient temperature, most of the energy we utilize it converted to heat, rather than power to propel our bodies or bikes. For example, 75% of the watts produced on a bike (or more) are converted to heat, so if you are riding at 200w, you are generating 600w of internal heat that needs to be dissipated… into potentially high ambient temperatures. This is what we are trying to better address with heat adaptation training… making the body more effective at managing core temperature. The body’s primary mechanism for dealing with increasing core temps is dissipating that heat with evaporation from sweat. This change in phase (liquid to a gas) absorbs a lot of heat, allowing heat losses even with high ambient temps (e.g. even when riding in the desert with outdoor temps in the 120’s, we still are able to lose heat through evaporation of sweat). The adaptations we get are increased blood volume, increased sweat rate, and earlier onset of sweating. How high can core temps be when exercising? Using Core temperature sensors, I regularly see athletes at 101-102 degrees F, even up to 103 degrees at times. Shockingly, in this paper (https://bjsm.bmj.com/content/53/7/426 ), athletes were observed hitting temps up to 105 deg F during time trials… yikes! For reference, the general recommendation is that at 103.5 F, there is a risk of heat exhaustion and at 104 F or more, it’s the classic definition of heat stroke (from a medical perspective). The key point is we want to manage core temp through better adaptations, to limit performance degradation and health risks.

Heat adaptation protocols themselves have been around and utilized for many years in various formats. They can be useful in driving adaptations that may help your body perform better in warm environments. Again, the overall goal is to maintain cooler core temperatures by sweating sooner after the onset of exercise, increasing sweat rates overall, and decreasing the amount of electrolytes lost in the process (more info located here). Part of the adaptation is increasing blood plasma volume, which may also have some additional performance benefits for some athletes*.

In the past, many of the studies and protocols were driven around the use of Saunas. This study from 2015 demonstrated a significant increase in plasma volume (17.8%) after four uses. This study from 2007 found an increase in athlete performance in time trials, after extended (21 days) sauna use. More recent focus has been on the use of hot baths for driving adaptations, as more athletes have access to a bathtub at home, and it may be easier to maintain specific temperatures than can be achieved in a shared sauna at a health club. Two studies were done, showing similar results, both demonstrating reduced skin temperature, reduced time for sweating onset, and improved performance in the heat. The first study in 2015 was with recreational athletes, and the follow-up study in 2018 was with endurance-trained athletes. A study in 2019 showed that the heat adaptation benefits can last two weeks, and another study from 2019 showed that even if you delayed the protocol until well after the exercise session (8 hours), you could still get heat adaptation benefits (although not quite as large).

One of the authors of the two hot bath studies first cited above, did an interview with MySportScience with practical guidelines on using a hot bath protocol, which can be found here. I highly recommend you review this link before doing any heat adaptation protocols, as heat adaptation protocols can add additional stress to the body and can be very taxing. The key infographic for this article is:

Again, if you are interested in utilizing this strategy to prepare for the heat, please review the documents/links carefully. Make sure you consult with your medical professional to ensure that your body can handle heat adaptation training. Note that heat adaptation training increases the stress the body sees, so you may need to cut your training back accordingly. It is critically important that you approach this in a safe and methodical manner. From both personal experience and feedback from many of my athletes, it’s a good idea to drink fluids while in the hot tub (or sauna) to help maintain hydration. I’ve personally lost 2-3 lbs in 30 minutes in a warm tub… keep your fluids up, just as you would when you exercise. As noted in the article, don’t try to go warmer than recommended. An inexpensive digital meat thermometer may be helpful in verifying the temps. It can also help to stir the water in the tub periodically, to help ensure that you maintain good heat transfer during the session (this helps keep the temp more uniform overall). Lastly, and most importantly… Listen to your body… if anything doesn’t feel right or feels bad, stop the heat adaptation protocol immediately.

* There have been some studies that have shown increasing plasma volume can increase performance, beyond just racing/training in warm weather. This study shows heat adaptation training improved exercise performance in both warm and cooler conditions. This study from 2019 and this study from 2020 both showed that hemoglobin mass increased after plasma volume increased (weeks after the increase), potentially increasing oxygen delivery after heat adaptation training over time.

Want more detailed information on heat adaptation? Check out the following podcasts of interest:

a) https://podcasts.apple.com/.../heat.../id1529312639... . This first one is from Anne Guzeman interviewing Stephen Cheung, who is recognized as one of the best researchers in environmental conditions (exercise, work, etc.). He gets into the discussion of different types of methods (e.g. riding when it's hot/or on the trainer vs sauna/hot bath), as well as providing just a great overview of the basics. This is a great place to start learning about heat adaptation. One interesting comment Stephen made was that females "may" need just a little longer for adaptation than males (a couple/few days more).

b) https://podcasts.apple.com/.../the.../id1545953110... . This second podcast is from Huberman lab. This gets into more of the brain interface with heat, as well as detailed discussions on sauna protocols and studies specifically. There are also interesting discussions on heat/cold protocols, and how they may be used to reduce cortisol and increase human growth hormone. Some different discussions than traditionally discussed when it comes to heat/heat adaptation.

Train smart!

If you are interested in training plans for ultra-racing and gravel events from T2M, currently available plans (and plans in the works) are located here. Coaching inquiries can be sent here. You can follow T2M on Facebook here, Twitter here, or Instagram here.

Thoughts on season planning for multi-day ultra-cycling races/events

A bit of background, for those that don’t know me (Greg Grandgeorge).  I’m an ultra-cycling coach who has been fortunate to coach some top finishers in TABR, BNUS, RAAM, RAW, TD, Big Sky, BC Epic, NSBR, and HooDoo over the past years… including Kraig Pauli, Evan Deutsch, Janie Hayes, Keith Morical, Heather Poskevich, Deanne Herr and Sarah Cooper.  There are a lot of potential strategies for planning your season for a big race like Trans Am Bike Race (TABR), BIKE NONSTOP US (BNUS), or any other multi-day race, and likely there isn’t one “right” way that will work best for everyone.  That said, here are some of the things that have worked well for athletes I’ve coached and may be helpful to you as you plan your training for your event.

At a high-level overview, the most important scheduling concept is consistent progression of training load. Progression, meaning we want to increase constructive training stress over time to allow your body to turn that stress/work into physical adaptations (fitness) for your race.  Consistent is a key word here as well, as nothing sabotages fitness gains like inconsistent training.  From observation, it takes nearly twice as long to gain back fitness lost by an extended break from training… 10 days of missed training takes around 20 days to get back… so after 30 days your fitness has gone nowhere.  Progression does not mean that each day has to be higher than the previous, or each week necessarily greater than the last (more about building in recovery strategies later), but that the general trend of load needs to increase over time, to constructively build fitness, and avoid excess accumulated fatigue.  Consistency doesn’t require perfection.  You don’t need to hit every workout perfectly, and you may miss a workout occasionally with travel, fatigue, or illness.  That said, the most successful athletes show up day after day, executing the vast majority of the work to reach their goals.  The key is to build your plan with realistic expectations of the training you can handle physically, and around your work and personal life schedules as well.

Typically, you will start building your schedule around your current fitness level and then target to peak training load about 4-6 weeks out from the race.  Why peak that far before the race?  Most fitness adaptations take time to occur, in the 30-42 day range.  By peaking a few weeks before the race itself, you can give your body a chance to turn that final high workload into useful adaptations.  This also allows you to drop back some of the training volume as you get closer to the race start, to shed fatigue so you can start the race feeling good.  One scheduling mistake (or maybe better said, less optimal) I see at times is people peaking a week before the race.  Generally, this isn’t enough time for the body to adapt, and simply results in the athlete starting the race tired, but not necessarily fit.  More about tapering later.

There are a lot of ways you can progress training load.  Before talking more about that, it may be good to discuss “training load” as well.  Personally, I like to schedule athletes using “Training Stress Score” (TSS) and “Chronic Training Load” (CTL), as these concepts help me to better understand the interaction of both training intensity and duration (see the hyperlinks for more information).  For a long discussion on different training models and adaptation strategy as a whole, see this paper.  TSS and CTL are metrics used in the TrainingPeaks application, which is what I use personally.  I have no vested interest in this app/service, and there are certainly other apps/software packages or strategies that can work equally as well (I’ve even created schedules with modeled TSS and CTL using a spreadsheet before most of the annual training plan tools were available)… use what is easy or makes sense for you.  For more on some of the acronyms or terms that I’ll use in this article, see this article or this reference.  When looking at training load, it may come as a surprise to some, but I don’t track the athlete’s miles… miles don’t matter to me.  Why?  Your speed (and therefore miles) is extremely dependent on the type of bike you are using, hills, wind, clothing, weight, etc.  For example, the same athlete can ride a fat bike in the snow for 3 hours to go 20 miles and do exactly the same amount of work (in kJ) as riding on a TT bike for 3 hours to go 65 miles… same actual physical stress, but dramatically different miles.  I’ve also seen some athletes focus so much on miles, that they end up doing rides that are so low in intensity (to hit a mileage goal for the day or week), that the benefits of the additional time may be questionable or even detrimental.  Questionable if the time on the saddle doesn’t produce either physical adaptations or at least some needed experience/confidence with long rides (see this paper on skiers with long-duration training and limited adaptation effects), or detrimental if the durations get so long it impairs the athlete’s recovery.  For my use, training load is then a function of the duration of training and the relative intensity at which the workout is completed. 

Quite simply, the overall goal is to consistently increase load over time, to have the best fitness possible with the time you have available to train.  A critical point, though, is that you need to effectively manage your fatigue.  Why?  Probably the most important thing my triathlon coach told me years ago before I started coaching myself, was fitness wasn’t built from exercise… rather, it was built recovering from exercise.  If you do not build recovery into your schedule, both over a period of weeks and even within a week, you risk the possibility of overtraining.  When this occurs, fatigue is high, adaptation stops, performance generally declines, and risk of injury increases.  True overtraining can take weeks or months to recover from as an athlete.  How can you build recovery into your schedule?  Most coaches build recovery (or step-back) weeks into training schedules.  Traditionally this may be building training stress for 3 weeks, and reducing both volume and intensity in week 4, to help shed accumulated fatigue.  There isn’t anything magical about a 3 build/1 week recovery schedule, and you can utilize different strategies.  Generally, for ultra-cycling athletes that have a high capacity to absorb loads, I’ll use a 3/1 format.  For those that show more signs of fatigue, I’ll use a 2-week build/1 week recovery strategy.  Many times I use both, with a 3/1 earlier in a training plan when volumes are lower (e.g. during the winter), and then move to a 2/1 when the volume gets higher as we get closer to the race.   From a practical standpoint, I’ve found that the long ride on recovery weeks is often about half the duration of the last week in the build cycle (to manage fatigue or TSB values), although you may need to drop a bit more when you are getting close to your peak weeks.  In terms of dropping intensity during recovery weeks, I find that most athletes tolerate tempo level work, so I will include a bit of tempo work, but generally keep the average intensity of the entire workout reasonably low… 75% or lower intensity factor as a rough rule of thumb.

Besides managing intensity between weeks, it’s also important to consider recovery and load within a single week as well.  Most of my ultra-cycling athletes train 6 days a week, with one day of complete rest.  Within the 6 training days, I have a mix of intensity, endurance, and some recovery days.  From a practical standpoint, typically the longest rides are done before the rest day.  The reason is that in general athletes are tired after a long day in the saddle, and the likelihood of being able to do a quality workout the next day is low… better to completely rest.  How much intensity and how it is scheduled depends on the athlete, the race/event, and projected fatigue levels.  I’ll add a bit more about intensity later, but in general, most weeks have 2 to 3 higher intensity days, with the balance being endurance or recovery days.  Intensity can create accumulated fatigue rather quickly.  Generally, it’s best for most athletes (in my experience) to provide at least 48 hours between higher intensity sessions.  For example, if we schedule Monday as a rest day, then Tuesday, Thursday, and possibly Saturday could be higher intensity sessions.  Typically, this might mean that Wednesday is a general endurance ride, Friday is an endurance ride (or recovery ride), and Sunday is a long endurance ride.  If the intensity is really high (e.g. FTP or higher focus), it may take even longer to recover, and sometimes this warrants having 72 hours between high-intensity sessions (e.g. Tuesday and Friday high intensity, with Wednesday recovery, Thursday, Saturday, and Sunday endurance).  The point is that it’s good to think about how much fatigue the workout is likely to create and ensure you are giving your body the chance to recover and turn your hard work into adaptations.  It can be helpful to look at Training Stress Balance (TSB) to help anticipate fatigue within the week, as well as between weeks for your monthly loading. 

Why does intensity matter, and should I include it in my training schedule?  Higher intensity work drives different adaptations.  Yes, endurance work is critically important for ultra-cyclists and is the foundation of any training plan.  That said, higher intensity work helps to increase a cyclists’ threshold power, increase stamina as well as improve fat oxidation rates.  Why are these important?  Although a lot of multi-day racing is done at relatively low intensities, increasing threshold power helps to increase overall speed.  For example, let’s consider two athletes with the same weight and same aero profile, with the first having a threshold power of 250 watts while the second has a threshold of 300 watts. If they are both riding at 45% of their threshold power, Rider 1 will be riding at 113 watts and Rider 2 at 135 watts.  How much does that change speeds on a flat road?  At 165 lbs and a CdA of 0.38 Rider 1 will be at 15.8 mph and Rider 2 at 17.0 mph.  Climbing a 5% grade, Rider 1 will be at 5.4 mph and Rider 2 at 6.4 mph… obviously this makes a big difference when riding across the country.  (Here’s a tool if you want to calculate bike speed from power.)  Higher intensity riding also improves your ability to hold power longer, called stamina.  This is important when riding extended mountain grades in the West, or even the repeated short and steeper climbs in the East.  Higher intensity work (at the right targeted zones) can also increase fat oxidation rates.  This provides more flexibility for your body to use either stored fat or ingested fat, with less reliance on carbohydrates for fuel (and a lower likelihood of bonking).  What types of workouts are the best?  There isn’t “a” best type of higher intensity workouts… it depends heavily on the athlete and their specific race.  In general, I find that if I am focusing on building power, FTP or VO2 type work often can really help, but it’s really important to manage fatigue.  Often this is best when the overall volume is still reasonably low (for athletes with more history/experience).  As a whole, sweet spot and tempo work are more manageable for most athletes.  Tempo work is pretty well tolerated by most, even when fatigue is higher, as it tends not to create as much residual fatigue.  (Note when I refer to tempo training, I tend to think about it in a narrow range for cyclists… 78-82% of FTP… at or slightly above lactate and/or ventilatory threshold 1, and well below sweet spot).  Sweet spot work does need to be managed from a recovery standpoint, and it is less effective if the athlete’s threshold power is close to their VO2 Max.  But, both of these can be useful in developing power for many, as well as improving stamina and fat oxidation, with less risk of accumulated fatigue than FTP or VO2 work.  For more on training zones and the adaptations that can occur, see this article by Dr. Andrew Coggan or his updated zoning discussion here

In addition to gradually building training load, it’s also beneficial to build race-specific practice sessions into your schedule.  Although this can be simply doing other races leading up to your event, often I think race simulation workouts may be better for many athletes, as they typically do not require tapering or as much recovery as a true race, which translates to better fitness adaptations over time.  How can we build it into the training plan, and what are things we should consider?  The first is obvious… simply incorporating progressively longer single-day rides into your training schedule… 8, 9, 10 hours, etc.  This can give you a chance to practice your nutrition/fueling, work on gear, etc.   Likewise, we can also stack endurance rides over a series of days, to better simulate race conditions.  For example, we could do an 8-hour endurance ride on Saturday and a 4-hour endurance ride on Sunday.  This helps prepare your body (and mind) for what it feels like to get back on the bike after a long day of riding (creating resilience… being able to ride day after day).  Depending on your work schedule, this can also be a Friday night, Saturday, Sunday plan, where you ride away from home, practice sleep strategies, check out gear, practice nutrition, etc… simulating your race situation before getting into the race itself.  Stacked rides can provide you the chance to test things that are more difficult in single-day rides (e.g. charging devices, lighting, sleep gear/strategy, etc.).  Because stacked days create more acute loading and fatigue, it is important to be thoughtful about when to use them and to give yourself adequate recovery afterward.  Some thoughts on key items to consider in your race simulation training:

·       One of the important aspects is working your planned nutrition into your long workouts.  For shorter events, you may carry your nutrition (or have it in a vehicle for supported races), but for longer unsupported events, you’ll likely be buying your food along the way.  Your gut is trainable, meaning absorption rates of nutrients and water get better with practice.  If you are bringing your own nutrition (or in a supported event), make sure you are using that over your long rides.  It’s not unusual for athletes to get taste fatigue… meaning after a while the thought of drinking another of the same bottle or eating the same food item may begin to create nausea.  If you are an unsupported racer, you should be practicing with items you can buy at grocery stores, convenience stores, or restaurants similar to what you will find on your race route.  You need to know what works and doesn’t work for your stomach and consider how many calories per hour you need to take in on average, to meet the demands of your event.  Your long rides give you a chance to work this out before the race.

·       Check out your gear.  Ride with it and understand how your bike handles loaded, where you should pack your things so you can find them easily, what you need to carry, what isn’t needed, what works well, and what doesn’t and needs to be changed.  Within this category, consider and practice with your electronics for navigation, as well as testing battery usage (in warm and cold conditions) as well as working out your electronics battery charging strategy.  Do some riding in various weather conditions, day and night, to check out rain gear and cold weather gear, to match the conditions (the best you can) that you’ll face in the race.  Consider what you’ll do for bike maintenance, and practice this between rides as well.

·       Night riding.  Obviously, this creates the opportunity to really test lighting (and charging of lights or your dynohub operation), but it’s also good to practice riding into the night, as well as starting early when it is still dark, so you know what to expect from a fatigue standpoint.  For some of your long or stacked rides, practice finishing in the dark and starting in the dark.

·       Sleep.  There are a lot of theories on sleep.  Many try to target sleep around 90-minute intervals, to help wake around natural sleep cycles, sleeping 3 hours, 4.5 hours, or 6 hours per night.  Likewise, napping can be effective, at either less than 30 minutes or again a 90-minute interval to match sleep cycles.  It can be beneficial to try some of these strategies in your practice rides, on a limited basis.  For example, if you do an 8-hour ride on Saturday, you can potentially ride into the night, sleep 6 hours, and then start in the dark the next morning (depending on dusk/dawn timing), to both see how your body feels and practice some night riding.  It is important to consider your recovery when doing sleep practice like this, so you are not chronically short on sleep, risking compromising your benefits of the work done over the weekend.  Ideally, you can make up lost sleep with a nap later on Sunday as well.  It’s worth practicing… but not on every long ride and every stacked race simulation weekend. Sleep is critical to your recovery and needs to be a high priority during your training season (see this paper on optimizing sleep hygiene), and it is very important to get back to your good sleep routines as quickly as possible after race simulation weekends

.·       Stops / Routines.  Race simulations can help you become more efficient off the bike, if you think about your strategy and practice it.  Often the biggest difference in total finish time is time off the bike.  It’s hard (practically) to gain more time by riding faster after stopping longer.  Each minute wasted during the day often means less time for sleeping that night.  Race simulation rides give you a chance to create and refine your own strategies.  Some common tips are to think through all the things you want to accomplish or get before making stops (e.g. bathroom, food, water, clothing change, etc.).  Track your stopped time on some of your long rides, and proactively consider ways you can speed your stops… convenience stores can eat up a lot of time. Likewise, it’s often better to do three things at one stop, rather than stopping three times to do one thing each time.  Routines can be helpful, and they can be created and practiced during your stacked rides.  Examples are what steps you will take when you get to a hotel (or wherever you sleep) before going to bed, and what steps you need to do before leaving in the morning.  For example, decide what electronics needs to be charged, what bike maintenance needs to be done, what self-care needs to be performed, etc. before sleep, or what will be done in the morning.  Even if you practice your sleep strategy at home… make it as race-like as possible… don’t eat food, use any gear or clothes, that you didn’t carry in on your bike, just like you’d do in the race. If you are planning on sleeping in a bivy or tent, make sure you practice it sufficiently to be able to put it up and take it down quickly, when you are tired and/or in difficult weather conditions.

 As mentioned previously, for most athletes it works well to hit your peak training load 4-6 weeks out from your race/event.  What does training look like after your peak?  For example, let’s say you peak 5 weeks out from your race.  Typically, the following week is more about recovering from the big load to shed acute fatigue.  The following week (3 weeks out) can be more of a maintenance week, where we maintain training load, rather than build, while incorporating a bit more intensity.  Two weeks out we can drop more load, and increase intensity, to begin the taper period.  Again, it is important to consider overall fatigue levels and ensure you are shedding fatigue, to feel good for the start.  The reason we often maintain or increase intensity during the taper is to help minimize fitness losses as we lower training volume.  It is a balancing act for everyone, but the execution can be dependent on the individual.  For those that tend to shed fatigue slower, we may peak earlier, with more time to shed fatigue.  For higher volume athletes, it may make sense to peak a bit later.  The week of the race is generally lower volume riding, with a few shorter and harder tapering workouts… but nothing so hard that it risks creating additional fatigue of stiffness.  Ideally, you will have your final gear preparation done before race week (in terms of gear, logistics, etc.) so you can be relatively low stress and can use the extra time for extra sleep before starting your race.

 So, what are typical peak values I see for CTL’s (for those who use that methodology)?  From observation, I find that most experienced athletes can do most events with CTL’s of around 105 to 120.  For athletes that are closer to the front of races, I typically see CTL’s of 120 to 140, and the leaders in the 140 to 180 CTL range.  Certainly, there are exceptions to these ranges, as CTL values are relative to you and your intensity, and are not directly comparable to others.  We could have two athletes that both have CTL’s at 120, both have identical aero profiles, but Cyclist 1 has a w/kg of 2.0 and Cyclist 2 has a w/kg of 4.0. Obviously, Cyclist 2 will be faster in the race, assuming they execute similarly… simply due to the additional power.

In addition to having a progressive cycling schedule, it’s also important (IMO) to include strength training into your training program.  As you increase training load, your body will naturally try to make you as efficient as possible at riding… often this comes at the expense of muscle atrophy in other areas of your body.  In particular, it is important to maintain stabilizing muscle strength (cycling is in one plane of motion) as well as upper body strength, to help prevent injury, minimize upper body fatigue on the bike, as well as to help maintain bone health.  Typically, including strength-work two times per week can help maintain a base level of strength balance.  Practically, these are best scheduled on shorter endurance days, after the ride, to minimize strength adaptation signaling. Typical exercises include a focus on core work, glutes, and hips, as well as maintaining upper body strength with shoulders, back, chest and arms. As part of both strength training and just high-volume training in general, it’s good to ensure you are getting adequate protein intake. One of my favorite resources on the topic of protein… how much, how frequently, when… is located here.

 I’ve heard that the biggest obstacle to success is not having a plan, and the second is following a plan at all costs.  The point is that it is important to put together a plan to help you succeed with your races, but it’s also important to be willing to modify your plan as needed, based on how your training is going overall.  Keep in mind, outside stressors (work, family, etc.) impact your body similar to exercise stress, and can impair your ability to recover (which can impair adaptations or potentially lead to overtraining).  It is important that you listen to your body, watch for signs of accumulated fatigue, and modify if needed.  This can be an area where a good coach can help.  That said, many athletes successfully self-coach or follow training plans, and it can be very helpful during high volume training to both subjectively quantify how you are feeling daily, and compare it with more objective methods such as HRV (heart rate variability) tracking.  I have tried several HRV tracking apps and have zero vested interest, but appreciate the simplicity and accuracy of HRV4Training and recommend it to my athletes.  Whether you use this app or another, they have a great four-part series on understanding how HRV can be a good tool (in addition to how you feel subjectively) to help guide training, located here.  

If you want to create your own training plan, TrainingPeaks has this article on how to create a plan within their platform, located here.   Again, you can use other platforms (there are plenty out there), or even a simple spreadsheet.  The important thing is to create a plan that uses consistent progression to peak your training load for your race goal, incorporates adequate recovery, includes race-specific intensity, and incorporates the opportunity to practice race strategies.


If you are interested in training plans for ultra-racing and gravel events from T2M, currently available plans (and plans in the works) are located here.  You can follow T2M on Facebook here, Twitter here, or Instagram here

Gloves or Pogies... what is faster for me on a gravel race?

The TLDR version (you are welcome Mike M. 😉):

I performed a field aero test utilizing an Aeropod to see the potential differences between heavy gloves, Pogie Lites and Bar Mitts, with the following results:

  • For a 64.5 mile race (Cirrem), relative to gloves the Pogies Lites would cost me (be slower) 0:02:19, and using Bar Mitts would cost 0:02:10. 

  • For a 152.5 mile race (SHGU150), relative to gloves the Pogies Lites would cost me 0:05:16, and using Bar Mitts would cost me 0:05:00. 

  • For a 337.6 mile race (IAWAR), relative to gloves the Pogies Lites would cost 0:12:31, and using Bar Mitts would cost me 0:12:16. 

  • These are based on my specific aerodynamics and may not be completely applicable to others, but it should give you a general frame of reference.

In 2017, one of my athletes asked about the potential time loss for using Bar Mitts (generically called pogies) for 330+ mile Trans Iowa gravel race.  The temps were predicted to be very cold that year, and hypothermia was a big concern.  At the time, I made some assumptions, did some back-of-the-napkin math, and conservatively estimated that over the course of the event it may cost them 20 minutes in total time**.

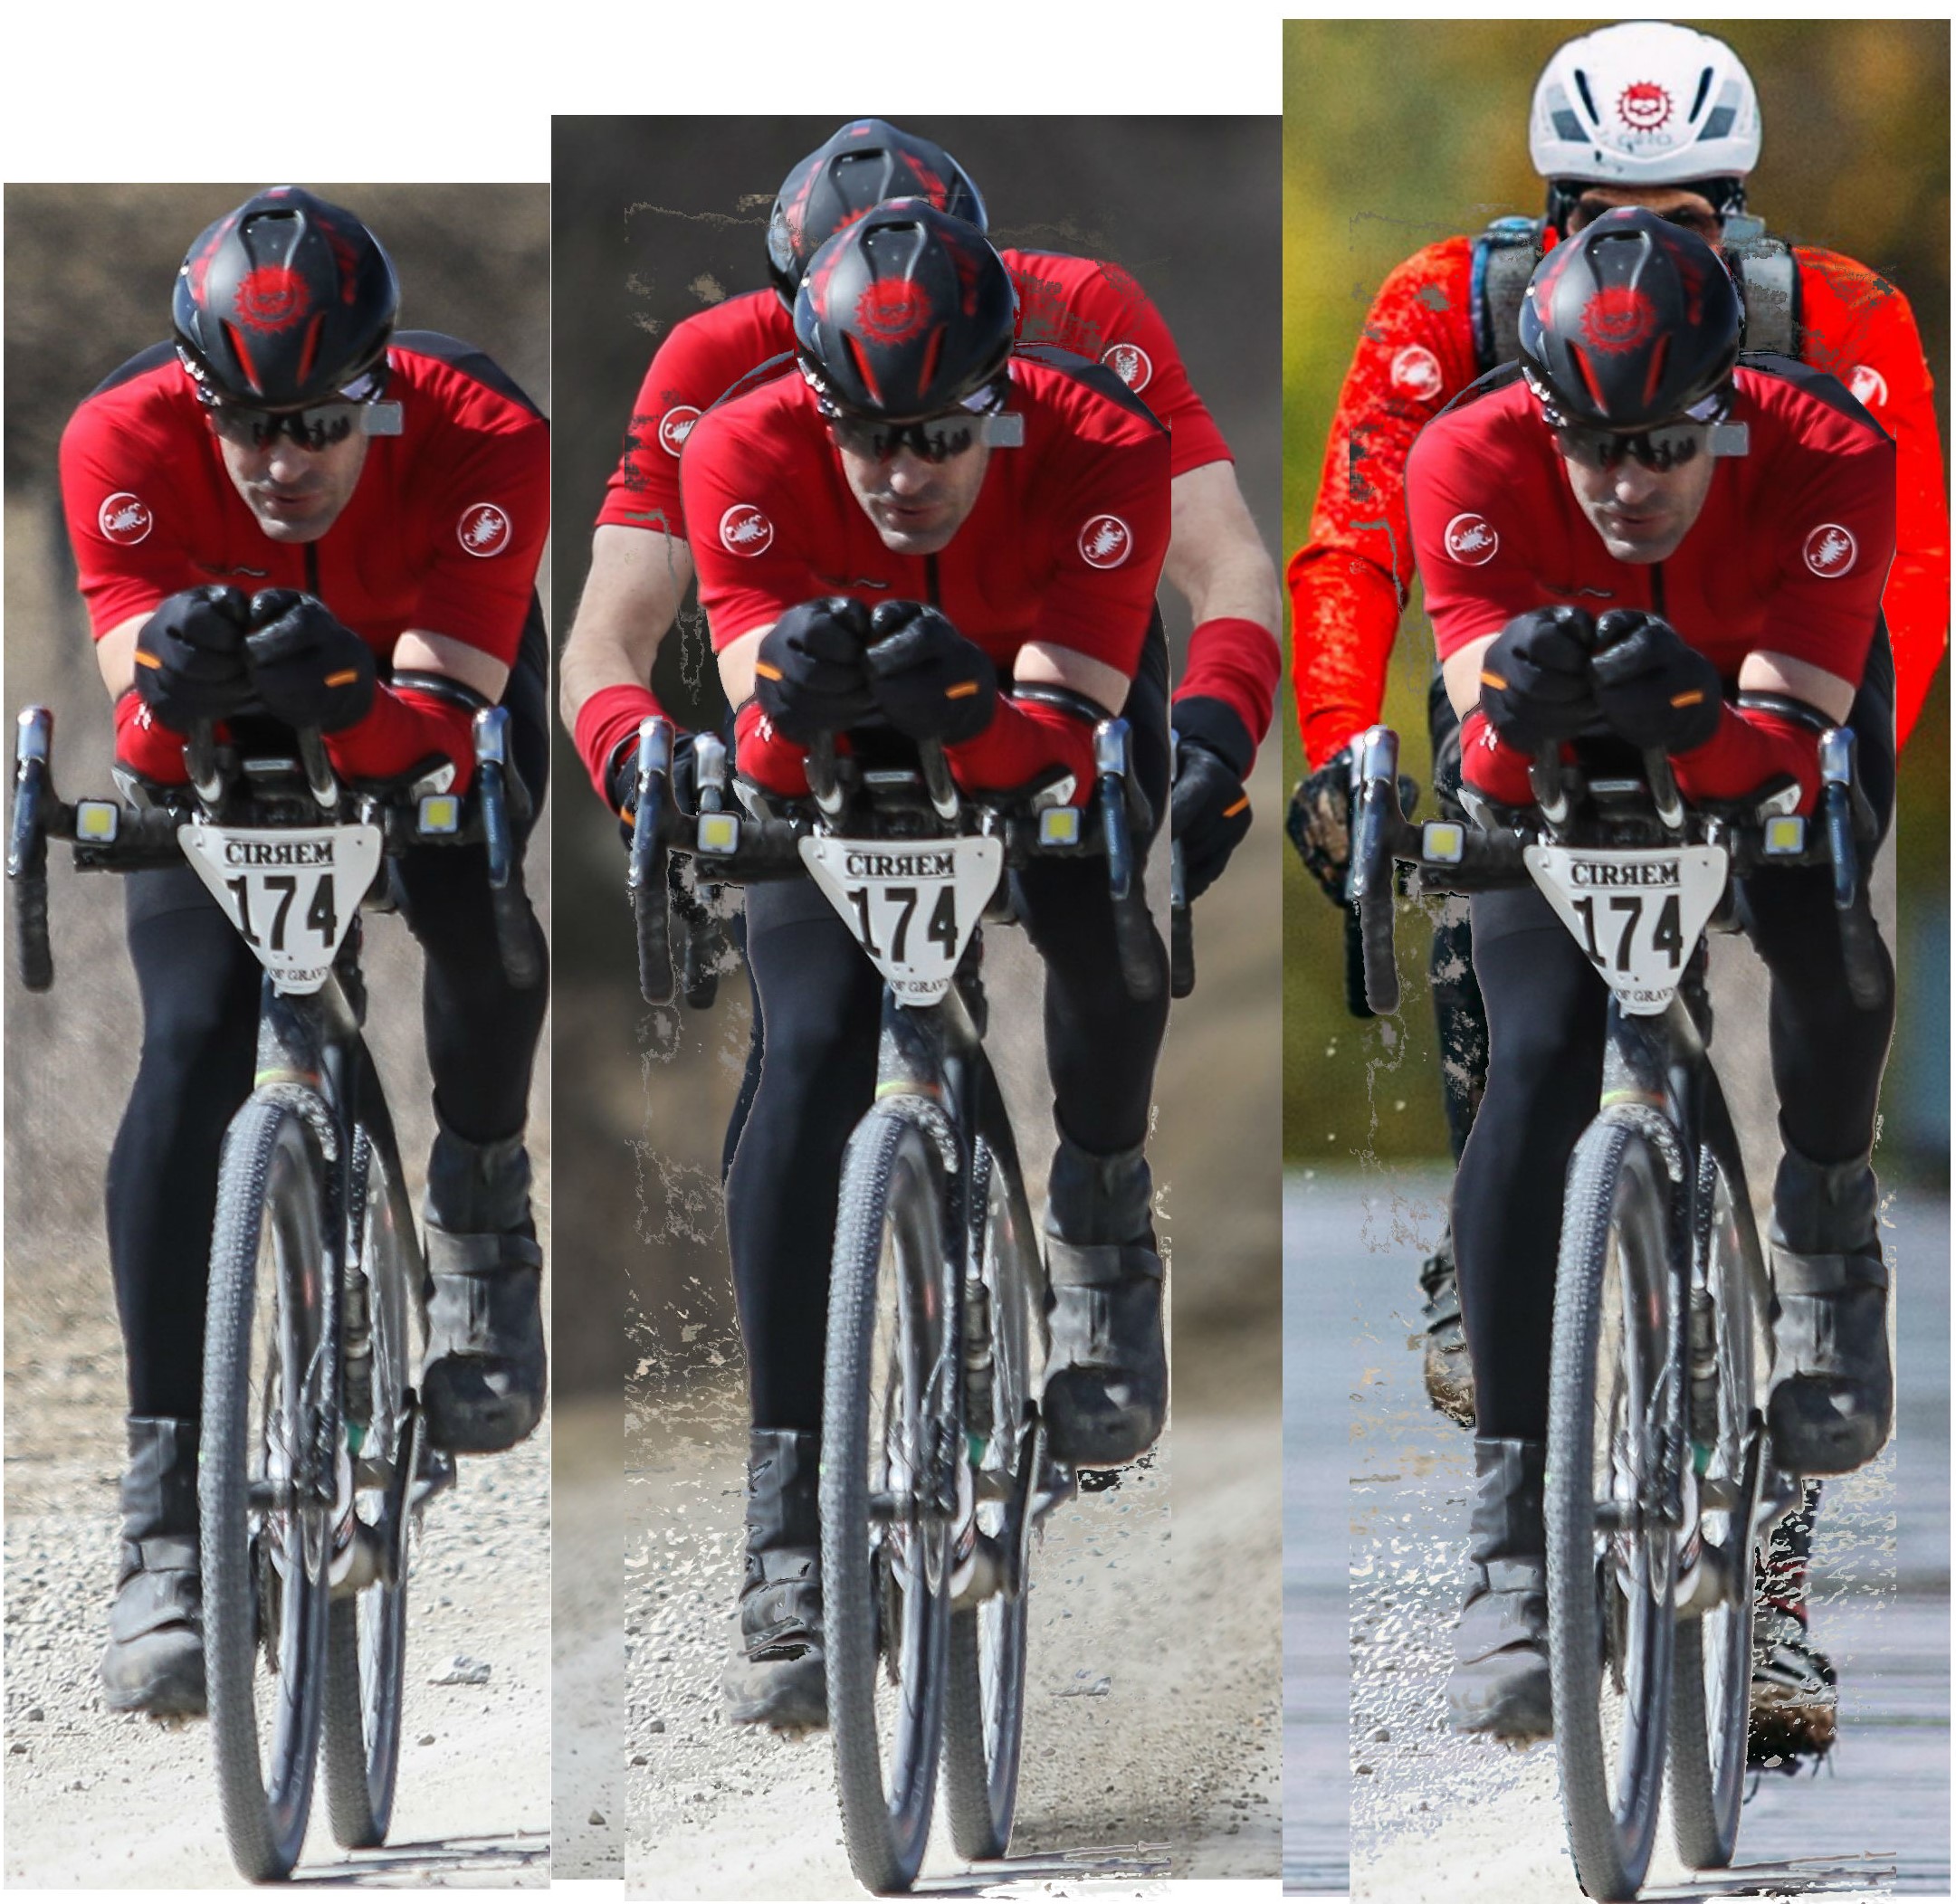
Recently I was taking photos at the Spotted Horse Gravel Ultra, and when reviewing the pics afterwards, I noticed the difference in handwear and once again wondered about the potential impact of gloves versus pogies.

Hand models, from the 150 miles Spotted Horse Gravel Ultra.  Left to right, gloves, Bar Mitts and Pogie Lites.

Hand models, from the 150 miles Spotted Horse Gravel Ultra. Left to right, gloves, Bar Mitts and Pogie Lites.

So, I grabbed my gravel bike and headed to the Water Works Park in Des Moines, where there is a reasonably low traffic circle where I can do field aero testing.  To perform the comparison, I utilized an Aeropod, which looks at real time air density, ground speed, wind speed, bike power and slope to estimate aero losses (assuming fixed rolling resistance and mechanical losses).  The testing is pretty simple… you ride in your circular route, maintaining a fixed body position, with each of your different equipment options.  You capture the data, and then analyze it using their software, to determine your CdA (Cd = Coefficient of Drag, A = Area). Your CdA directly impacts your overall aero drag, which is typically the biggest component of your overall bike power.  This page does a nice job of describing the physics involved, if you want more information.

Bar Mitts top, Pogie Lites bottom and Gloves in the center.

Bar Mitts top, Pogie Lites bottom and Gloves in the center.

The results of my testing were as follows:

                                                 Hoods CdA                  

  • Light Gloves                    0.415                           

  • PI Lobster Gloves            0.414   reference        

  • Bike Iowa Pogie Lites      0.431   (+0.017 / +4.11%)                   

  • Bar Mitts                           0.435   (+0.021 / +5.07%)                   

 So, the Pogie Lites and Bar Mitts do create a higher CdA (more drag) than using heavy gloves in my testing.   Interestingly, the heavy gloves were about the same loss as the light gloves (numerically better, but I suspect the difference is below the test accuracy overall).  Note that the Pogie Lites tested better than the Bar Mitts in this particular case, but I suspect they will be more variable in their CdA as they are made from a soft material that changes shape quite easily, which can change both the cross sectional area (A) and the coefficient of drag (Cd).  As a whole, anything that flaps or moves in the wind creates a high coefficient of drag.

Not content for a single test, I did another test in another location with a much smaller circular loop.  The day was windy (15 mph winds) and cold, which is less than ideal for aero testing as a whole.  As such, I was bundled up with heavier clothing for this ride.  Even though it was less than ideal conditions, I wanted to see if I saw any variance in the relationships with wind buffeting from different directions.  The route was only ½ mile, so I did 10 loops for each option (with wind hitting from all sides then) to see how it impacted the results.  In the second test, my CdA values were:

                                                 Hoods CdA                                          

  • 45 NRTH Heavy Gloves        0.496   reference        

  • Bike Iowa Pogie Lites            0.514   (+0.018 /+3.63%)                    

  • Bar Mitts                                 0.506   (+0.010 / +2.02%)       

 In this case, all the CdA values looked a lot worse, and as such, the percentage change the pogies made looked smaller.  We also see that the Bar Mitts tested better in this case than the prior… possibly due to the rigid shape and semi-aero friendly profile overall (speculation).

For simplicity, if we average my two tests, assuming sometimes I’ll be wearing heavier clothing and dealing with more wind and sometimes I’ll be with slightly lighter clothing and less winds, we end up with the following CdA values:

Hoods CdA        

  • Gloves              0.4550 reference

  • Pogie Lites       0.4725 +3.85%

  • Bar Mitts          0.4705 +3.41%

So, what does this actually mean… how does it impact my race times?

Let’s try three different local gravel race lengths, since I have my actual race data for Cirrem 100k in ‘18, Spotted Horse Gravel Ultra 150 in ‘16, and Iowa Wind and Rock 338 (IAWAR) in ‘19.  The actual temps may not have warranted pogies for these races, but it will provide a general idea of the impact over varying distances.  I didn’t try to match my actual race times, but rather used my past data to put in realistic power data for the model.  I also used the weather from the date of the race for the model as well.

First up, Cirrem.  Total mileage 64.5 with around 3400’ of climb (per RWGPS which tends to understate elevation gains):

Cirrem model, with Gloves, Pogie Lites and Bar Mitts

Cirrem model, with Gloves, Pogie Lites and Bar Mitts

I’m sure there’s a weight-weenies out there balking because I haven’t included the weight differences.  Well, I can estimate that as well.  My medium gloves, which I’d wear under the Pogie Lites or Bar Mitts, weight 3.88 oz, my Pogie Lites 3.46 oz, Bar Mitts 8.75 oz, and my heavy gloves (without pogies) are 5.82.  Unfortunately, BBS’s minimum weight change is 1 lb, so I re-ran the PL and BM options with an additional pound, which added 20s to the PL option and 19s to the BM run.  Then taking the ratio of 0.09 x 20s is about a 2 second slower time for Pogie Lites and 0.43 x 19s or 8 seconds slower for the Bar Mitts.

For my 64.5 mile example, using Pogies Lites would cost me 2 minutes and 19 seconds, and using Bar Mitts would cost me 2 minutes and 10 seconds. 

Next up, Spotted Horse Gravel Ultra 150.  Total mileage 152.5, with 12,655 gain according to RWGPS.

Spotted Horses 150 model, with gloves, Pogie Lites and Bar Mitts.

Spotted Horses 150 model, with gloves, Pogie Lites and Bar Mitts.

Using the same method to compensate for weight differences discussed above, the Pogie Lites would be 4s slower than shown and the Bar Mitts 21s.

For my 152.5 mile example, using Pogies Lites would cost me 5 minutes and 16 seconds, and using Bar Mitts would cost me 5 minutes even. 

The last example, from the Iowa Wind and Rock.  Total mileage 337.6, with 27,323 gain according to RWGPS.

Iowa Wind and Rock 337, with Gloves, Pogie Lites and Bar Mitts.

Iowa Wind and Rock 337, with Gloves, Pogie Lites and Bar Mitts.

Using the same method to compensate for weight differences discussed above, the Pogie Lites would be 18s slower than shown and the Bar Mitts 87s.

For my 337.6 mile example, using Pogies Lites would cost me 12 minutes and 31 seconds, and using Bar Mitts would cost me 12 minutes and 16 seconds. 

Overall, it looks like my original guestimate was conservative and pogies would cost me less than 20 minutes for a long race like Trans Iowa or IAWAR.

Other important considerations:

1.     This is all based on my aero test and doesn’t mean that wearing pogies for IAWAR will result in a 12-minute penalty for you (or other distances / times as discussed above), as your aerodynamics are different.  I think it will likely get you in the general zip code, but you could do your own analysis, even without an Aeropod, as noted below.  *

2.     The Pogie Lites came out better than I expected in terms of aero losses.  Soft material means more likely they will flap in the wind, which is bad for the coefficient of drag.  That said, I have really big hands.  In gloves, that means they fill up the Pogie Lites pretty well, which may make the Pogie Lites perform better on me than they would for someone with smaller hands.  With the thicker neoprene construction, I doubt that hand size would have much of an impact with the Bar Mitts.

3.     This analysis was based on a single position, riding on the hoods.  Obviously if you take your hands out and put them on the tops or on aerobars, the aerodynamics change and the results may change as well.  Yes, I did look at the impact when on aerobars (as I ride them frequently), but I need to keep some info privy for myself and my athletes… right?   I hope you understand… 😉

4.     This discussion is simply on aerodynamic loss estimates and not for suitability of the task.  Outside of this context, I have the following thoughts on the alternatives:

a.     Bar Mitts.  These are my choice for cold weather training rides because they are the warmest for me and easiest to get my big hands in and out of when riding.  Would I race in them?  Doubtful.  Even with a long race like IAWAR they are simply too big / bulky.  More on this below.

b.     Pogie Lites.  Being light material, I find they are note as warm for me as Bar Mitts, but work well down to about 20 – 25 degrees with my compromised hand and a decent glove (I have nerve damage in my hand from being run over by a careless driver).  The flexible material makes it a little more challenge to get my fat hands into, but also provides the inherent advantage of being able to shift or brake right through / over the pogie itself, if you hand is outside of the pogie.  They are also pretty light, pack small and are relatively easy / quick to get on and off.  That means on a long race (e.g. IAWAR) you could put them on / take them off as needed, without taking up a lot of room in your bag.  Would I race in them?  Yes, I think they would be good for low predicted temps for IAWAR or comparable races… possibly even shorter races like Spotted Horse 150 or 200 again if the temps were cold enough.

c.     Heavy Gloves.  Generally, this is what I’d race in for shorter races like Cirrem.  2 minutes + is an eternity at the finish line, and I’d lose a lot of spots with the aero losses.  It would take really cold temps for them to make more sense (where you are already bulked up with heavy clothes).  The other factor is being able to eat with what you are wearing.  If the gloves get too heavy / cumbersome, it somewhat restricts you (or me anyway) to a liquid diet, as they lack the dexterity to open food wrappers.  Again, this is fine for shorter races, but less than ideal for longer events.  In contrast, you can typically wear lighter gloves when using either the Pogie Lites or Bar Mitts.  

* So… what if you want to do your own field testing?

Since the time I was asked the original question, I’ve had the chance to do some field aero testing.  There are a few different methods that you can utilize, but a couple of the more popular are using the Chung method, via aerolab in the application Golden Cheetah.  This is a free app to download and use, and with a basic understanding, the aerolab portion is pretty easy to use for simple aero tests.  The second is a paid app, called Best Bike Split (BBS).  BBS is a great tool for estimating race times, and also contains a feature to estimate aerodynamic losses as well.  The third option is to use a device that estimates real time aerodynamic data, looking at power data, speed, wind speed, air density and slope (I use a product called Aeropod).  The advantage of the device is that it sees the actual wind speeds that are occurring during your ride, which provides greater accuracy than the software application only methods. With all methods, you need to have a power meter, as they all utilize the power data to work backwards and estimate CdA based on speed and assumed rolling resistance and mechanical losses. Likewise, each works best if you have reasonably low and steady winds, steady temps, and a consistent road surface.  Ideally your route is something that is loop where you can do multiple iterations to get any wind to hit from all sides, and also has low traffic for safety and riding consistency.  I personally use one of the loops near Water Works Park in Des Moines.  Once you have a good route, it’s a matter of riding the loop with consistent body position and relatively constant power.  It’s best if you can hold a reasonably brisk pace, say 18 mph or more if possible.  You want to make sure whatever power level you choose, that you can hold it relatively closely for all of your test runs.  Then it’s a matter of testing your base option and then your remaining positions or gear that you’d like to test.  I’ve created how to videos for:

o   Golden Cheetah / Aerolab.  This is probably the most widely used option for field tests.  It’s reasonably easy to use, and free.  I show how to use it here.

o   Best Bike Split.  This is a paid program that does the race modeling used above, but also has an aero estimator as well.  It’s easier to use than Golden Cheetah and also utilizes historic wind, temperature and humidity over the course of your ride, so I suspect it’s possibly more accurate than Golden Cheetah.  I show how to use it here

** My original back-of-the-napkin estimate from 2017: 

  • Assume a hand is roughly 6” x 3” without a mitt, 18 sq in

  • Assume a mitt adds 4” to each dimension. This seems like a lot to me… so this should be conservative… but again, I don’t know what they look like from the front on a road / gravel bike. 14” x 11” = 154 sq in. But, this may help compensate for the difference in drag coefficient, as a bar mitt would be more shaped like a block than an airfoil and probably reduces the drag coefficient as well.

  • Diff = 136 sq in x 2 hands = 272 sq inches

  • Or 1.888 sq ft, or 0.17547 sq meters

  • Throwing in 0.6 sq meters as the baseline into this calculator, making your weight 69 kg, bike 13 kg, and Crr 0.01, at 150w speed is 26.01 kph (https://www.gribble.org/cycling/power_v_speed.html )

  • Making the area 0.617547 to adjust for the mitts, the speed at the same power drops to 25.81 kph.

  • This translates to roughly 0.124 mph difference. At 30 hours, it’s 3.72 miles difference, or around 20 minutes overall.

  • Let’s say you get cold instead, and lose 10w over your average. This takes the speed (assuming no mitts) from 26.01 kph to 25.2 kph… closer to 0.5 mph… a much bigger deal than the aero loses of the mitts.

Feeling the pressure... what I learned from a gravel roll down tire test

I recently listened to three podcasts from the engineers at Flo Cycling, covering different aspects of tire pressure and rolling resistance (episodes 20, 21, 22, 23 and 24, two being two part podcasts). A couple of the guests made comments on gravel tire pressure that were something like, “lower your pressure until you just get a rock strike, and then add a couple of psi.” Their point was that people tend to put too much pressure in their tires, and they actually be losing some speed in the process. Generally, lowering air pressure increases rolling resistance. But, on bumpy surfaces the bouncing and vibration creates additional losses (and fatigue), which can more than offset the simple rolling resistance losses observed in a lab. Here is a great summary getting into some of the theory of losses associated with what is sometimes called suspension loss or tire “impedance” associated with bumpy surfaces. Another good article is here covering the basics of tire pressure (and why it’s good to experiment), and minimum pressure requirements here. I’d recommend reading or skimming the articles to get a good background on rolling resistance, or listening to the podcasts referenced above.

I have two sets of wheels and tires for my gravel bike, both set up tubeless. The first set is a set of 700c’s with Maxxis Rambler 120 TPI tires at 40mm and Stan’s Avion wheels, and the second are 650b’s with Terrene Elwood Light tires at 47mm and Hunt Adventure wheels. Worth noting, the Hunt wheels are only 22mm deep, while the Stan’s wheels are 40mm deep (aero advantage for the 700 set), but the 650b set weighs about 140g less than the 700c set (total both wheels). I’ve always wondered if there would be a noticeable difference in speed between the two sets of wheels/tires. From what I’ve read, most people “feel” 700c’s are faster, but I’ve yet to see any tests or data. So, it seemed like good motivation for me to spend some time rolling down and climbing back up a gravel hill, to see if I could come to any conclusions on the differences between the two tire sets, and alternatively… how tire pressure may impact speed as well.

First, let me comment that this certainly isn’t a lab quality test, and doing a roll down test on gravel certainly introduces a lot of variance… you never pick exactly the same line down the hill (meaning gravel will change based on path taken) and as you ride there is the chance that the gravel may change from even being packed down a bit by the bike tires. There is also the chance that winds, temperature, air pressure or even my body position may change, impacting aerodynamics. I also realized going into this that any results would be applicable only to my bike, wheel and tire combination. That said, I thought there may be some interest in the gravel community on what I found as part of this process.

Historically I would run 36 psi front, 40 psi rear on my 700c tires, and more recently tried 34/38. I hadn’t really dug into any numbers, but more or less asked others what they rode and just tried a few different values along the way. In the back of my mind I’ve always expected more pressure to be faster, based on rolling resistance testing done in labs (discounting suspension / impedance more than I should). Going in to this test, I decided to measure the weight on my front and rear wheels, with me on the bike. After averaging my front and rear weights on the bike from five samples each wheel, I and found my weight to be around 190 lbs total (me, bike, clothing, hydration, tools, etc.), with a very close distribution of 40% front and 60% rear. I decided to try to balance the contact patch size front to rear, so I calculated what my front tire should be with my rear around 40 psi. Doing some quick math: 75.9 lbs front / (113.8 lbs rear / 39.6 psi rear) = 26.4 psi front (rounding to 26/40, front / rear). I then calculated what a similar starting point would be for the 650b set, so it would have similar tire tension (see this article on tire tension, and how to set pressure based on different tire widths). Since I was already at relatively low pressure, I decided to drop the average pressure by 5 psi for the second set of tests and another 5 psi for the third (each resulting in a drop of around 4 psi front, 6 psi rear).

I headed to a short but somewhat steep gravel hill, relatively close to home. The gravel was a mix of somewhat fresh (sandy) and somewhat packed… no heavy limestone and no super hard concrete-like surfaces either… just a general representative blend. I decided to do five runs with each wheel set at each pressure, resulting in 30 total runs.

AC823E65-0121-4E94-8EF6-365F3969B6FB.JPEG

The data is shown below, with the wheel size and air pressure (front/rear) shown in the left column. The results are in inches traveled (down the hill and partially up the other side). The average of the five runs, the percent difference (650b at the highest pressure was my baseline, row 1), as well as the standard deviation and the percent deviation.

Screen Shot 2019-05-16 at 8.47.57 PM.png

My thoughts on the results:

  • None of the differences were large enough (relative to the standard deviation) to draw any statistical significance. In other words, from a statistical point of view, the variances between options could simply be “noise” in the data from run to run.

  • Interestingly, the average of the 650b and 700c wheels at the highest pressure were the same. I double checked my field notes twice, since the averages came up virtually identical. The average distance was slightly better on the 700c’s than the 650b’s (as a whole, including all pressures), but again not to a significant degree. There wasn’t much difference in the 650b performance when varying tire pressure… maybe a little slower (less distance traveled), but the differences were very small. For the 700c’s, they seemed to get faster at lower pressure (more distance traveled), at least in terms of the averages between runs (again somewhat small differences). I suspect the small changes in performance based on pressure are a result of using light casing / more supple tires. As discussed in this article, lighter casings tend to transmit less vibration, lower rolling resistance, and have much smaller changes in performance as pressure changes.

  • From a perception and feel standpoint, there was one notable difference, and it was rear tire traction when climbing back up the hill in a standing position. The 650b’s were a bit better than the 700c’s (but the tread pattern is different too), but both got noticeably better as the pressures got lower. At my highest pressure the 700c’s were difficult to climb in a standing position, with a lot of wheel spin compared to limited spin at the lowest tested value. The other perceived difference was vibration. Maybe a placebo effect, but the bike felt smoother as the pressure dropped, but maybe a little soft or squishy at the lowest values. Part of the perceived difference may also be that calculating to better equate pressure to load resulted in lower front tire pressure than I have traditionally utilized.

My takeaways from this test:

  1. For my situation, at pressures similar to what I’ve run historically, there isn’t a big difference between my 700 and 650 wheel sets / tires. That said, at slightly lower pressures, there may be a slight edge for for the 700’s, and of course the deeper wheels would provide more benefit for windy days. On days with more fresh gravel or mud, I’ll continue to grab the 650’s.

  2. I will be running lower air pressure in both sets going forward. Upon more refection, the static weight balance (40/60) may not be completely realistic, as when you are pedaling, you put pressure on the downward stroke which occurs in front of the bottom bracket (at the distance of the crank arm), which may shift the center of gravity slightly more forward. Likewise, I also use aerobars, which will also shift more weight to the front wheel as well (although the methodology was okay for this test, as I coasted only and rode on the hoods). Using the middle air pressure range and changing to a 45/55 weight distribution, this would result in a pressure of 25/31 psi F/R rear for 700c wheels and 22/26 psi F/R for the 650b wheels.

To make this a bit easier going forward, I created a small spreadsheet to estimate my air pressures based on overall weight, tire width and weight distribution (below). I’ll start with one of my favorite quotes, “all models are wrong, but some are useful”. There are a lot of caveats / notes to this… #1 is you need to make sure you are within your wheel and tire manufacturer’s guidelines, and you maintain enough minimum tire pressure to ride safely (see this article). This of this just as a starting option, and adjust according to feel. I’d start with an adjustment factor of +20%, and work your way down in testing / riding. My comfort point was at 0% adjustment with my specific bike, tires and wheels combination. I’ve listed some notes and links in the spreadsheet as well.

Again, if you use this calculator, make sure you are within any and all manufacturer’s guidelines for your specific bike, wheels and tires. Be safe, smart and have fun experimenting!

Maintaining workout quality while on "trainer vacation"...

Most people know I'm a big fan of bike trainers.  They are a very safe and time efficient way to include focused interval work into your schedule.  No worries about cars, weather, road conditions... just hop on and hit the power targets.  A good bike trainer can be used to build or maintain power year round.

That said, it's not unusual for trainer motivation to wane when it's beautiful outside.  Just because you are taking a break from the trainer, it doesn't mean that you can't continue to build quality work into your schedule with focused intervals.  With a little thoughtful planning, you can do intervals and enjoy the outdoors.

Here's some tips on doing interval work outdoors:

  1. Ride safe.  ALWAYS ride aware, and slow down and/or adjust your power/speed based on the situation (traffic, road conditions, etc.).  Making your intervals look perfect is not worth an accident, period.
  2. Choose an appropriate route... ideally with very low or no traffic. 
    • Bike trails.  Some bike trails can work well for intervals.  In particular, flat and straight routes without a lot of other cyclists can be ideal (e.g. some sections of the High Trestle Trail).  This can give you a long sight line, to ensure you can safely maintain higher power / speed.  Obviously, trails with a lot of curves, limited sight distances, frequent intersections and a lot of walkers would not be a good choice.
    • Hilly county roads.  Hill repeats on a quiet road with a decent shoulder can be a good option as well.  This can provide you with a consistent way to hit your target power on the climbs, and use the descents as your easy recovery.
    • Gravel.  Yep, these days I do most of my outdoor intervals on gravel.  Generally gravel is much quieter with significantly less traffic.  It also creates additional resistance, so speeds aren't as high and it's easier to maintain steady power.  Obviously you need to make sure you have suitable conditions where you can maintain good control of your bike.
  3. Faster isn't better.  The point of intervals isn't speed, but rather focused power (or HR) targets.  I've found it easier (and safer) to ride "slower" bikes for interval work, to help maintain steady power and avoid excess speed (particularly on trails).  Examples are using a gravel bike with aerobars rather than a TT bike, or using a fat bike instead of a mountain bike, to find slower (meaning greater aerodynamic and rolling resistance) options with at least similar geometries.  
  4. Keep it simple.  Anyone who has done some of my interval workouts knows I can get creative at times with multiple target intensities within a single high power block (e.g. mixing VO2 and sweet spot work, etc.).  While these can provide some incremental benefits, they are easier to do on a trainer.  Outdoors, it is generally easier to execute (and remember) intervals composed of simple blocks (e.g. 6 x 7 minutes at 90% power). 
  5. Technology can be your friend.  In the past, I would print out my workout and tape it to my bike to stay on track.  Many of the more recent bike computers have workout modes.  Personally, I have both a Garmin 820 and a Wahoo Elemnt Bolt, and really like the Wahoo for doing structured workouts.  Although you can sync workouts from TrainingPeaks on both devices, the Wahoo's default workout screen gives you a nice visual of key metrics from the workout (see below).  I find this works very well for me to stay on track.
  6. Accept imperfections.  This tends to be the hardest item for most people I coach, as most are type "A" people and want their workout data to look perfect.  ;) In the end, it doesn't have to be spot on with the plan, to still get a valuable workout in.  It's fine to have some variance with some blocks a bit higher than others, lower recoveries, longer / shorter blocks when you need to accommodate your route, etc.  It's way more productive to have some structure than no structure, while still enjoying the outdoors.
This was an athlete riding very rough gravel roads.  They were able to work the intervals into the terrain, enjoying the beautiful scenery where they were riding, and still meeting the intent of the interval intensities.  

This was an athlete riding very rough gravel roads.  They were able to work the intervals into the terrain, enjoying the beautiful scenery where they were riding, and still meeting the intent of the interval intensities.  

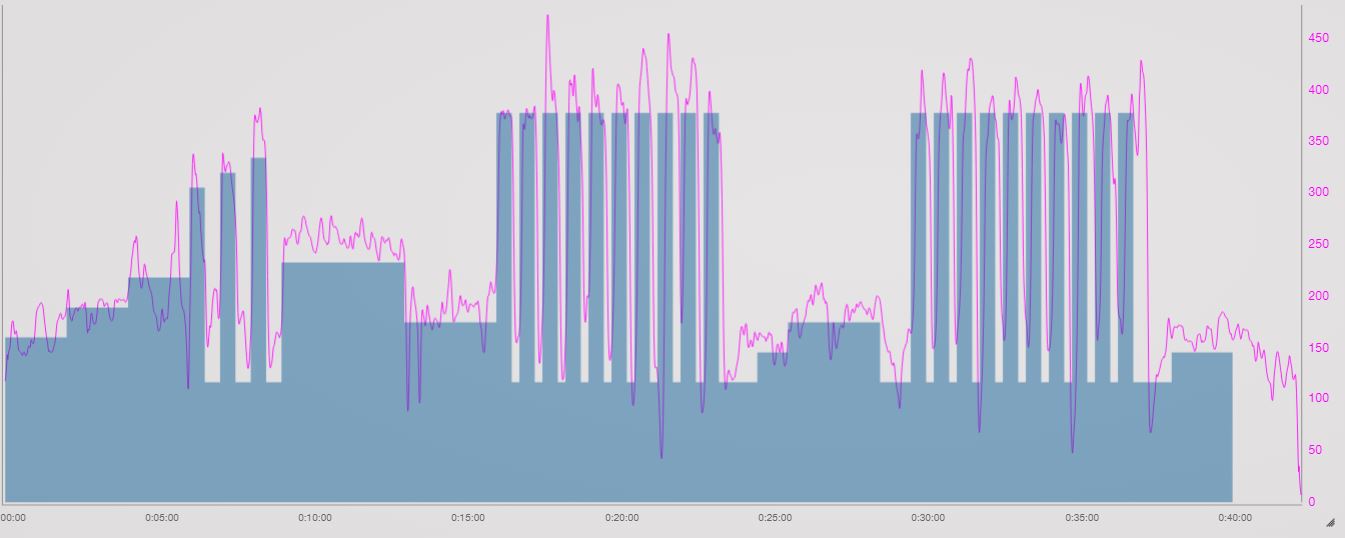
A Billats example... short intervals with higher than threshold targets.  This was done on flat gravel roads with zero traffic, making hitting the targets much easier.  

A Billats example... short intervals with higher than threshold targets.  This was done on flat gravel roads with zero traffic, making hitting the targets much easier.  

In this example, the athlete did hill repeats on quiet paved roads.  She was able to hit the target intensites in both the higher power and recovery modes.  

In this example, the athlete did hill repeats on quiet paved roads.  She was able to hit the target intensites in both the higher power and recovery modes.  

Here's the Wahoo Elemnt Bolt, doing the Billats example above.  This is the default workout mode screen and it captures all of the data I need to do intervals outdoors (or indoors... it can control smart trainers too).  I like the visual o…

Here's the Wahoo Elemnt Bolt, doing the Billats example above.  This is the default workout mode screen and it captures all of the data I need to do intervals outdoors (or indoors... it can control smart trainers too).  I like the visual of the workout shown at the bottom of the screen, so I know how much suffering remains.  ;)  It also has gives you an audible beep / countdown before changing intervals, and gives you the upcoming target power.  Note that nothing is perfect... I have had a couple of workouts it couldn't load correctly from TP, but the vast majority of the time it has worked well. 

So, go ahead and enjoy the weather... but keep training smart!

Do you have tips and suggestions for doing intervals outdoors?  Let me know your best strategies and ideas.


Aerobars on a gravel bike... are you kidding?

Coming from a triathlon / time trial background, I've always been a big believer in trying to squeeze every bit of speed from every single watt of power I produce.  When I first started riding gravel, I took a bit of flack on mounting aerobars on my gravel bike.  Although some of my friends used them (also coming from Tri backgrounds), most people didn't.  Certainly it takes a bit to get accustomed to using them on a less predictable surface like gravel.  That said, I find my heart rate drops 2 to 3 beats per minute in aero position over the hoods, and it gives my hands, wrists and back a bit of a break.

But, does it really have the potential to improve times in a gravel race?  In my recent race at the 2018 Cirrem race, they "seemed" to provide benefits, as I was able to pass both individuals and small groups later in the race as the winds got higher.  To help quantify the potential difference, I created a model using Best Best Split of the Cirrem course.  I created three model bikes to replicate riding on the hoods, the drops or in aero position.  All other aspects of the bike were identical, with the exception of the weight, as I dropped the hoods and drops bikes by 0.7 lbs to compensate for not having aerobars.  The three bike models are shown below:

Bike based on riding on the Hoods position.

Bike based on riding on the Hoods position.

Bike in the Drops position.

Bike in the Drops position.

Bike utilizing aerobars.  Note the weight is slightly higher on this third bike to compensate for the aerobars.

Bike utilizing aerobars.  Note the weight is slightly higher on this third bike to compensate for the aerobars.

To determine the CdA values, I utilized the general values from the Cycling Power Lab site, shown here.  Essentially, Tops are at 0.4, Hoods at 0.35, Drops at 0.31 and Aerobars at 0.29.  These were reasonably close to Best Bike Split values as well for each position.  In my personal experience, I think these are likely a bit aggressive for gravel bike applications (or ultra cycling applications), as generally people have bags, water bottles, less aero clothing, pumps, etc. that you normally wouldn't see in traditional wind tunnel testing.  That said, utilizing lower values would create more conservative differences between the models.

Note that I did check my bike models versus actual times / power values to ensure I was in the right zip code.  I adjusted the bikes and course models  to make sure they were reasonably close to actual times of some known rides, by incrementally increasing Crr (rolling resistance), and altering the climbing position and maximum speeds of the model.  For consistency, I utilized the same 0.08 Crr value for all the bikes.  For the routes, I used a climbing speed of 12 mph (meaning below this value you are on the hoods, and above you'd be in the drops or aerobars for those two options) and a maximum speed of 25 mph (meaning above that speed you'd stop pedalling... but gravity can take the bike faster).

The results for the Cirrem ride were shown below:

Cirrem.  Riding on the drops at everything 12 mph and over would save nearly 5 minutes over riding the hoods, or 2.2% increase in speed.  Riding on aerobars would save nearly 7.5 minutes over the hoods (3.4%) or about 2.5 minutes fast…

Cirrem.  Riding on the drops at everything 12 mph and over would save nearly 5 minutes over riding the hoods, or 2.2% increase in speed.  Riding on aerobars would save nearly 7.5 minutes over the hoods (3.4%) or about 2.5 minutes faster than riding the drops (1.2%). 

 For fun, I decided to see how it would impact a couple of local races I did last year as well.  The first was the Buffalo 105, which was a longer race (on a windy day) that had less climbing (per mile) than Cirrem.  The second was the Gents Race, which is a very flat course that had very little wind last year.  The results for the two races:

The Buffalo 105.  The drops would be a 10 minute improvement over the hoods, representing a 2.7% increase in speed.  The aerobars would be almost a 15 minute increase over the hoods (4.1% increase in speed), and almost 5 minutes faster tim…

The Buffalo 105.  The drops would be a 10 minute improvement over the hoods, representing a 2.7% increase in speed.  The aerobars would be almost a 15 minute increase over the hoods (4.1% increase in speed), and almost 5 minutes faster time than the drops (1.3% faster).

Gents race.  The drops would be a 6 minute improvement over the hoods, representing a 3.2% increase in speed.  The aerobars would be almost a 9 minute increase over the hoods (4.8% increase in speed), and almost 3 minutes faster time …

Gents race.  The drops would be a 6 minute improvement over the hoods, representing a 3.2% increase in speed.  The aerobars would be almost a 9 minute increase over the hoods (4.8% increase in speed), and almost 3 minutes faster time than the drops (1.6% faster).

In these three examples, we can see aerobars representing 3.4 - 4.8% increases in speed over the hoods (average of 4.1%), with aerobars improving speed 1.2 - 1.6% over the drops with an average of 1.4%.  Clearly the impact will change based on the course (more hills, less benefit), speed (more benefit at faster speeds), drafting (less benefits when you draft) and wind conditions (more benefit on windy days).  The other subtle difference between the models in each race was that although Normalized Power (NP) was roughly the same, Average Power (AP) was lower on the drops and aerobars.  The reason is that the model assumes the same climbing position (so the peak power on the hills is about the same), but on the downhills you can spend more time coasting (or pedaling with less power) with a more aero position.

How would differences in size and/or power impact the numbers above?  Of course not everyone is my size and weight (6'1" and 167 lbs).  I re-ran the models with a hypothetical female at 5'4" and 130 lbs.  To come up with the differences in CdA, I utilized an online calculator that estimates CdA based on height (this was also varied by position so that there was less difference as body position became more aggressive). I varied the power output to target finish times around the times of the top three females at Cirrem.  The results are shown below:

Cirrem, hypothetical female.  riding on the drops at everything 12 mph and over would save 4 minutes over riding the hoods, or 1.5% increase in speed.  Riding on aerobars would save nearly 5.5 minutes over the hoods (2.2%) or a little less…

Cirrem, hypothetical female.  riding on the drops at everything 12 mph and over would save 4 minutes over riding the hoods, or 1.5% increase in speed.  Riding on aerobars would save nearly 5.5 minutes over the hoods (2.2%) or a little less than 2 minutes faster than riding the drops (0.7%).  On an aside, the top 3 females in cirrem finished within 2 minutes of each other, so it is possible that if some were riding aero versus hoods, it could have impacted finish placement.

I also created a hypothetical male, at my height (6'1") and 190 lbs, and then targeted a completion time around 4:30.  These changes resulted in the following:

Cirrem, hypothetical male.  riding on the drops at everything 12 mph and over would save over 5 minutes over riding the hoods, or 2.0% increase in speed.  Riding on aerobars would save nearly 7.5 minutes over the hoods (2.9%) or a little l…

Cirrem, hypothetical male.  riding on the drops at everything 12 mph and over would save over 5 minutes over riding the hoods, or 2.0% increase in speed.  Riding on aerobars would save nearly 7.5 minutes over the hoods (2.9%) or a little less than 2 minutes faster than riding the drops (0.9%). 

As noted earlier, I suspect the actual CdA's of most gravel riders are higher than "average" values used in this model, meaning that the aerobar benefits are likely higher than the model projectsions, in real world riding.  For reference, I've added a couple of pictures of race photos of me in different riding positions:

Aero position left, crouched hood position center (climbing) and normal hoods position.  The center position is likely close to a drops position from a head height, although with my hands in the drops my arms would not as been as wide.  No…

Aero position left, crouched hood position center (climbing) and normal hoods position.  The center position is likely close to a drops position from a head height, although with my hands in the drops my arms would not as been as wide.  Note that I lined up the wheel sizes in each photo, so the scales are relatively close.

Superimposed image of aero on the other two positions.  You can see the significant difference in cross sectional area between aero and the other positions.  Besides the area differences, upright riding also increases the coefficient of dr…

Superimposed image of aero on the other two positions.  You can see the significant difference in cross sectional area between aero and the other positions.  Besides the area differences, upright riding also increases the coefficient of drag as well.  

In the end, if you race / ride in packs or teams most of the time, then the aerobars would only provide benefit when you are pulling... so it may be only a marginal benefit (and it may make you harder for your teammates to draft behind you).  If you are comfortable (and disciplined/consistent) in getting into the drops when riding solo, then there is a small benefit to aerobars (0.7% to 1.4% increase in speed in the models above).  If you are more like me who tends to spend more time solo and on the hoods rather than drops, then aerobars can provide a more significant boost in speed... around 2-4%, depending on your size and speed. 

There are two important nuances to understand in the data / analysis above.  The first is that if you are going slower, you will see a lower percentage improvement in speed by becoming more aerodynamic.  That said, because you are going slower, you spend more time on the course, so those differences in speed yield relatively similar total time savings.  I ran my original Cirrem data with lower power, targeting an hour slower total race time.  This resulted in a speed difference between hoods and aerobars of 2.9%... well below the 4.8% increase in speed shown in the original example.  But, the net time savings of aerobars at this lower pace still resulted in a total time improvement of over 8 minutes... almost as much time savings as when I was traveling at a higher rate (9 minutes).  The point is that aero matters, even at slower speeds.

The last key point is that speed and power are not linear relationship.  Without changing any other variables (aero, rolling resistance, etc.) to increase speed by 4% requires around 11% more power.  So, would you rather try crank out 11% more watts for a 3-4 hour ride, or just use aerobars?  ;)  


A model for 4-24 hour cycling events... a.k.a., don't run out of steam....

Ultra endurance events (e.g. 4+ hours in duration) present some unique fueling challenges.  Too few calories, and there is a high chance running out of stored glycogen and bonking, and too many calories and you significantly increase the chance of gastric distress.  In this article, I want to share some general concepts on fueling (and some associated links for further reading), as well as possible model for planning / reviewing fueling on cycling events lasting 4 to 24 hours in duration.  In a future article, I'll address some of the differences for long course triathlon fueling.... but the fundamental concepts are similar.

To provide a general background, there are few key things to understand when planning for race day fueling:

  1. Calories consumed are only valuable if they can actually be absorbed by your gut. Over-consuming calories generally leads to excess food, fluid and gas in the gut, which can lead to cramping, nausea, stomach shutdown and an early end to your race. This article is one of the best summaries on what most people can generally actually absorb per hour, written by Asker Jeukendrup, a leading exercise physiologist and sports nutritionist.   In a nutshell, most people can absorb around 60 grams of a single type of carbohydrates per hour, which translates to around 240 cals/hr (4 cals/gram).  If you mix multiple sources (e.g. maltodexterin and fructose), absorption rates can often reach 90 grams of carbohydrates per hour (or around 360 cals/hr). Besides the quantity of carbohydrates, other factors impact absorption as well, such as:
    • Exercise intensity.  The higher your intensity level, the more your blood is diverted away from your stomach to working muscles. This slows the digestion process and can potentially reduce absorption rate of calories.  Ironically, this means that as you are going harder at the beginning of races and are burning calories at a higher rate, you are processing your food at slower rates, increasing the deficit between what you are consuming versus burning.
    • Carbohydrate concentration.  Your stomach processes carbohydrates more efficiently with water.  If you have too many carbs and not enough fluid, your stomach will process the carbohydrates more slowly.  The takeaway is if you have solid foods (or even gels/GU), it is important to consume them with water to assist absorption.  Drinking a sports drink on top of a GU may end up with high concentrations of carbs, slowing absorption.
    • Individual variance.  Absorption rates can be impacted by "training your gut" to a degree. This is simply practicing your race day fueling on your long workouts, so your body becomes more adapted to processing fuel while exercising.  Also worth noting is that body size is not necessarily correlated to absorption rates... meaning larger people don't inherently absorb carbohydrates faster than smaller individuals.
  2. The amount of calories burned is a function of the work you are performing over time. For cycling, an estimate of your calories burned is approximately 3.6 calories per watt of average (not normalized) power... more details can be found here.  So, for a person averaging 100w per hour, they will burn around 360 cals/hr, while someone riding at 200w per hour will burn 720 cals/hr. The takeaway is that the harder your work (in absolute terms, watts... not relative terms, intensity), the more calories you need for a particular event.  The paradox is that larger individuals generally require more power to achieve the same speed, but may not process (absorb) calories any faster than a smaller person.
  3. You don't actually have to consume as many calories as you burn.  Your body has stored glycogen in the muscle, which serves as energy stores for muscle contraction. In general, most people have around 375-500g of glycogen stored within the body, which translates to 1500 - 2000 calories.  One important note is that glycogen stored in one muscle cell cannot be transported to another... meaning unused glycogen stored in the bicep muscle cannot be moved to a quadriceps that is running out of energy.  The point is that not all 2000 calories stored in the body may be readily available to your working muscles.  The other key factor is your muscles also utilize fat for energy as well. Oxidizing fat for energy (e.g. burning fat) is a slower process than utilizing carbohydrates, and in general your ability to utilize fat as a fuel source is dependent on exercise intensity. The higher the intensity... the more your body relies on carbohydrates rather than fat.  As long as your calories burned is less than the sum of calories consumed + fat oxidation + stored glycogen, you avoid the bonk.
  4. Hydration and Electrolytes can impact your performance and/or health.  There is a lot of debate about the proper amount of fluids required for longer events.  One one hand, there have been studies showing that performance can be impacted when weight loss from sweat exceeds 2% of body weight. Decreased hydration levels tend to increase heart rate, reduce sweat rate (increasing core temperature), and increase glycogen usage in the muscles.  On the other hand, consuming too much water (or fluids) and lead to hyponatremia, which is a potentially life threatening condition.  The American College of Sports Medicine has a very informative paper on both hydration and electrolytes here.  In general, they are recommending that you supplement water up to your sweat loss rate (but not more), and 0.5-0.7g of electrolytes (sodium) per liter of water.  Here is an online tool to help you calculate your sweat rates, based on your actual workouts.  Note that sweat rates are highly dependent on temperature (and also humidity), so it is a good idea to understand your sweat rates at varying conditions.  For example, under relatively normal riding conditions (e.g. 70 degrees) I lose around 24 oz per hour on the bike.  On cool days may lose 16 oz/hr or less, and on warm days I may lose up to 40 oz/hr (and have recorded over 50 oz/hr running on hot days).  Personally, I expect to lose some weight on the course.  I sweat quite a lot and my gut isn't always willing or able to absorb enough fluids to keep up on a really hot / humid day.  Likewise, as you burn your stored glycogen, you will lose the associated weight as well.
  5. Not all types of foods are processed by your gut equally.  Protein, fat and fiber all slow the digestion process, so they generally should be avoided for race day supplements. Although protein can help reduce some muscle damage for long events, in general it's not needed for events lasting less than one day.  For multi-day events, protein is recommended to help minimize muscle loss over time. Protein is also great outside of race day for training recovery, and muscle building, as discussed here. So... on race day... focus primarily on carbs, and try to avoid foods that will sabotage your calorie absorption. There are a lot of prepackaged options for carbohydrates, including sports drinks, gels (GU), chomps, waffles, bars, etc. Often a mix of products helps to provide a taste overload of one type of product, and may help with absorption if they are from multiple types of carbohydrates. The key is to test different products during long training rides, to identify what your stomach will tolerate.  One product that seems to be tolerated by most people is Maltodextrin. It is the primary ingredient in CarboPro, as well as in the Hammer gel products.  The other consideration is the use of caffeine during exercise. Most studies show some benefit on performance, although it can create GI problems for some people. Again, using the product during some training sessions can help you identify how it impacts you individually.
  6. "Winging it" generally isn't a good strategy... or really a strategy at all.  A few small things can really help keep your fueling on track. Of course you initially need to consider if you are carrying, buying, refilling along the way.  As mentioned previously, it's good to test your fueling while training.  This can help you determine if you need to carry most of your nutrition with you, or if your gut is tolerant of things you can pick up (at supported races) or buy at a convenience store for unsupported races.  As you consider options, it's important to review where you have opportunities to refill water and restock your nutrition (e.g. mix up sports drinks, move gels to convenient feed storage, etc).  This should be planned in advance, so you are not wasting time figuring it out during the race.  Finally, consider how you are going to stay on task.  Personally, I set my Garmin to give me an alert every 15 minutes, triggering me to eat or drink to stay on my planned schedule.

With a common frame of reference on the basics of fueling, the following spreadsheet allows you to model your fueling for events from 4 hours to 24 hours in duration.  You simply input five variables (Fat Oxidation Rate, Starting Average Power, Power Decay, Total Event Time and Target Calorie Intake) and it will show an approximation of your calorie deficit per hour (or surplus) as well as a running total of your deficit or surplus.

I read a quote some time ago that I find applicable... "All models are wrong, some are still useful" (George Box).  With that in mind, it's important to understand that there are a LOT of variables that will impact the accuracy and results of this model (e.g. your actual fat oxidation rate, your metabolic / cycling efficiency, your actual fatigue decay, etc.).  That being said, this model can provide a general framework that can be helpful for both reviewing past races as well as planning for future races.

The spreadsheet is shown below.  Note that there are two pages... the first is the model, and the second can be used for manual input of hourly average power and fueling, for reviewing past races.
 

For an example of how the model can be used, I'll use the some data from two gravel races I did this year, using the Actual Ride tab first:

24HOCFuel.JPG

The first is for a 125 mile gravel race, where I rode around 7 hours and 20 minutes, and consumed around 193 calories per hour.  I held wattage / intensity fairly well, but started feeling a bit low on energy and my power dropped around hour 7.  At this point, my calorie deficit had gotten below -1600 calories based on the model... and my wattage dropped after that point.

GWFuel.JPG

This second example was a 150 mile gravel race, over a little more than 8.5 hours of actual race time.  In this case, I held intensity though hour 6 again, but started dropping off again in hour 7. Although I consumed more calories in the second race, I also burned calories at a faster rate. Again, at around -1600 calorie deficit, my power started dropping off.  

Graph of actual power (blue line), modeled power decay (orange) and calorie deficit line (grey).  Note that around -1600 calories my power dropped off significantly, which was similar in the first example as well.

Graph of actual power (blue line), modeled power decay (orange) and calorie deficit line (grey).  Note that around -1600 calories my power dropped off significantly, which was similar in the first example as well.

Is a 1600 calorie deficit the "magic" point to avoid for everyone?  No... this is simply two data points for a specific individual (me).  But, the point is that based on my race history, I can use this tool to help create a strategy for my next race in terms of wattage and the associate calorie intake. For example, if I want to make sure I can ride for 14 hours and stay out of the -1600 calorie deficit range, I'll need to cut back my power slightly at the start and consume more calories during the race.  Or, I can consider higher wattages, but I need to make sure my gut can handle the additional calorie load without ending up in GI distress.  This tool simply makes it easy to adjust the numbers, and see how it impacts your calorie deficit over time.

SHGUFuel2.JPG

Often the biggest obstacle to success is not having a plan.  The next biggest challenge is following a plan at all costs.  It's important to create road maps for success, but also being willing to adapt as conditions change.

Again, all models are wrong... but I'm hopeful that you'll find this model useful.  The most important point is understanding the basics of fueling, and creating an appropriate plan for your specific needs.

Additional Notes:

  1. I have notes included on the spreadsheet for more information on fat oxidation rates. There is a fairly wide range of individuality, based on your fitness, types of food you consume, sex, etc.  0.5 g/min is a reasonably conservative value for a typical endurance athlete, who is not utilizing a high fat low carb diet.
  2. The tool works best if you know your actual power output.  Keep in mind, this is average power power per hour, not normalized power, for 1 hour periods.  I have some links on the spreadsheet under the notes section, for estimating your power output in terms of FTP (Functional Threshold Power).  In general, for a >4 hour event, most average power starting ranges (first hour) would be between 75% to 85% of FTP, with elite racers at the high end (or even slightly higher) and newer or more conservative racers on the lower end of the range.  The power decay rate allows you to modify how your power decreases with each hour of the race.  The larger the number input, the faster the decay of power. If you have an idea of how much your power drops by a certain point based on past races, you can adjust the power decay variable accordingly.
  3. The total estimated time is your best estimate of the race duration.  Note that you can also be conservative and pick something an hour or more after your projected race finish, to see if that impacts your calorie deficit in case the race takes longer than expected.

Accuracy, Precision and Virtual Power...

I'm a big fan of using indoor trainers for building cycling power and strength.  I recommend the use of trainers for interval work all year round.  When the weather is nice, it is hard to beat riding outdoors for longer endurance rides.  But, utilizing a trainer allows you to target and execute on very specific intensity levels without the concern or interruption from traffic, intersections or weather.  How beneficial can quality trainer work be?  Check out this record setting 24-hour cycling performance, where the vast majority of this athlete's training was done on an indoor bike trainer.

One of the best ways to target and quantify workout intensity while cycling is to use power as a metric. Unlike heart rate, power is not impacted by fatigue, core temperature or hydration level.  Power also reacts very quickly to changes in intensity (which HR does not), allowing for quantification of short duration VO2 max sets, such as 30 second billats.  Although prices for power meters have dropped substantially in the past couple of years, the price of power meters is still a significant obstacle for many cyclists.  Likewise, electronic "smart" trainers than can actively control resistance (e.g. you dial in 200w and it provides 200w of resistance, like a Wahoo Kickr or CompuTrainer) tend to cost as much or even more than a power meter, putting them out of reach of many athletes.

During the past couple of years, a few software programs / apps have created a simulated power metric, called "virtual power" (e.g. TrainerRoad).  Using an Ant+ or Bluetooth speed sensor mounted to your rear wheel, the app reads your speed and uses a mathematical equation to estimate power based on a known or estimated resistance curve.  The user can then see their "virtual power" and change their intensity level to meet their specific workout targets.  Utilizing virtual power for indoor training purposes allows the user to get many of the benefits of training with power, without the need of the up front cost of an actual power meter.  

Each manufacturer designs their trainers with their own proprietary resistance curve, which is typically a function of the trainer design.  As such, some indoor trainers are much better than others for use with virtual power.  To understand why, it is important to understand the concepts of precision and accuracy.  Below is a great graphic providing an overview of both concepts, and how they relate to each other:

Ideally, your trainer would have both high accuracy and high precision.  In my experience (both personal and with athletes that I coach), I've found the Kurt Kinetic Road Machine to be a great trainer to provide both high accuracy and high precision.  They have been designed specifically for this purpose, and unlike other manufacturer's, Kurt Kinetic actually posts their resistance curve on their website.   

I've had a couple athletes that I coach use both virtual power and then actual power (from a power meter) using two different fluid-based indoor trainers.  The first used a Kurt Kinetic Road Machine, and the second used a CycleOps Fluid 2 trainer.  Both were using TrainerRoad to calculate virtual power.  I looked at a series of segments from multiple rides to see how the actual power compared to the virtual power calculation.  Here's how the Kurt Kinetic trainer performed:

Kurt kinetic, virtual power from website data.

Kurt kinetic, virtual power from website data.

This first graph (above) is a plot of the virtual power from the equation listed on their website.  The graph below is how TrainerRoad estimated virtual power versus the published data:

virtual power from trainerroad, plotted on kurt kinetic equation... a good fit of data!

virtual power from trainerroad, plotted on kurt kinetic equation... a good fit of data!

As you can see, the virtual power (blue diamonds) from TrainerRoad lined up very close to calculated data from the Kurt Kinetic website.  This shouldn't be a surprise, as they likely use the published resistance curve. Below is the actual power data (red squares) plotted on top of the previous graph:

Actual power plotted against virtual power for the kurt kinetic road machine.

Actual power plotted against virtual power for the kurt kinetic road machine.

As you can see, the actual power was very close to the virtual power calculation... well within the power meter's level of accuracy (within plus or minus 2%).  This is an example of a trainer that is both precise and accurate.  

Next we'll look at a CycleOps Fluid 2 trainer.  I find these to be very popular locally, with a lot of athletes using them.  Unfortunately CycleOps does not publish a resistance curve equation, just a picture of their resistance curve on their website.  

Cycleops fluid2 trainer plot and polynomial trend, based on trainerroad virtual powerA

Cycleops fluid2 trainer plot and polynomial trend, based on trainerroad virtual powerA

As you can see, the virtual power calculations from TrainerRoad follow a very consistent and predictable trend for the CycleOps Fluid 2 trainer.  Now, let's see how the actual power compares to the calculated virtual power:

cycleops fluid 2 virtual power plot versus actual power.  red squares are the actual power with blue diamonds being the virtual power.

cycleops fluid 2 virtual power plot versus actual power.  red squares are the actual power with blue diamonds being the virtual power.

In this case, you can see the TrainerRoad virtual power model for the CycleOps Fluid 2 is neither accurate nor precise. The average error is around 15%, but it ranges from less than 1% error on a few data points at the high power end to over 50% on the lower power values.  One could argue that the problem is simply that TrainerRoad's virtual power model is creating the accuracy problem.  That may be a contributing factor, but part of the accuracy problem could also be a result of the lack of precision or repeatability of the data... it's hard to create an accurate mathematical model with wide swings in data.  Without publishing an actual equation for the speed / power model, it's difficult to tell what the manufacturer had targeted for a resistance curve.  Likewise, although the plot above is the aggregate data, there was distinct ride-to-ride variation (one day to the next).  Even worse, there was variation within the ride... the longer you ride, the more the resistance increases for the Fluid 2.  Looking at one example, the average for three segments approximately three minute in length within a single longer interval set resulted in the following speed / power relationships: 14.6/126, 14.3/129, and 13.9/133.  As the segment continued, the speed dropped by 4.8%, while the power rose by 5.6%.  In this particular example, the virtual power would have shown power dropping from 154 to 143 as speed dropped, while power actually increased from 126 to 133.

So, what does this mean?  If you want to use virtual power, your best bet is to get an indoor trainer that is both accurate and precise. 

  • With a trainer that lacks precision and accuracy, your FTP (functional threshold power) would not be comparable to anyone else's, and you may not have confidence that you were actually executing on your targeted power zone.  I would be inclined to watch my heart rate closely under these circumstances, to ensure I was on target.  Or... if you are thinking about upgrading your trainer, rather than spending $300+ on a new trainer, consider the possibility of simply investing in one of the newer lower costs power meters instead (e.g. 4iiii Precision or Stages). Having actual power trumps the accuracy and precision issues of a trainer, and can be used outdoors for training too.  
  • If your trainer is precise (repeatable day to day and within the workout), but not accurate, then comparing your FTP with someone else's FTP is meaningless.  But, with a precise trainer and virtual power, you can establish a virtual FTP value and feel confident that when you are targeting zone 2 or zone 5 work, you are actually training within those zones.  
  • With a trainer that is both accurate and precise, you have much more confidence that you can compare your power output with others, and that if you are targeting Zone 2 or Zone 5 work... you are actually training within those zones.   

Train smarter... not harder.

Notes:

  1. I have no vested interest in the Kurt Kinetic trainers, and get no income if anyone buys their product.  I have simply found that every time I have verified trainer performance with a power meter, the Kurt Kinetic Road Machines have followed the predicted model very closely.  Here is a great video giving more details about their fluid resistance unit.


The often unappreciated and sometimes misunderstood bike tire... :(

In cycling, aerodynamics is king and gets nearly all the attention... aero bikes, aero wheels, aero helmets, computer bike fitting... it's all high tech and "sexy" stuff for the geeky triathlete.   On the other hand, tires are often simply considered a "wear item" that needs to be replaced periodically and pumped up before you ride.  

Before you write off tires an unimportant, let me help you understand why tire choice matters.  For a typical age group triathlete who generates around 3 watts/kg on the bike, you have far more to gain or lose through tire choice than any gains you can make with a set of Zipp wheels.  

To demonstrate this, I compared two very popular Continental tires: Gatorskins and GP4000s.  Gatorskins are a top seller for good reasons.  They are known for being puncture resistant, they last a lot of miles and are considered a top training or commuter tire.  The GP4000s are a top selling racing tire, known for it's low rolling resistance.  But how much does rolling resistance really matter?  I created a model in Best Bike Split and compared two sample riders (a hypothetical male and female) over Olympic and Ironman length courses to see just how much difference tires can make.  I ran a total of six scenarios per rider, per course (total 24 runs) and the short answer is for your average age grouper in the 16 to 20 mph range... choosing a racing tire over a training tire provided more speed gains than paying $250 for an aero helmet and $3000 for a deep carbon front tire and running a solid carbon disc on back.  For an Ironman length race, the GP4000s tires save around 16 minutes over the Gatorskins at the same power level and the full aero accessory package (helmet & wheels) saves only around 7 minutes.

I've listed the results below.  From a modeling standpoint, I've assumed 3w/kg FTP, IF's of 90% for Olympic and 70% for IM, CdA's of approximately 0.31 (typical of non-optimized body position), 6' 175 lb male, and 5'-4" 125 lb female.  The scenarios show below are 1) Gatorskin tires with standard road helmet and wheels, 2) GP4000s with standard road helmet and wheels, 3) GP4000s with Latex tubes (rather than standard butyl tubes), 4) Gatorskin tires with aero helmet, 5) Gatorskin tires with aero helmet, 808 front & disc rear, 6) GP4000s with latex tubes, aero helmet, 808 front & disk rear:

Because not everyone does long course racing, I also included an Olympic length race so you can see the impact there as well.

In terms of dollars spent for speed gained, tires are a great "bang for your buck".  Although Gatorskins and GP4000s tires are on opposite ends of the spectrum in terms of rolling resistance, most manufacturer's standard tires are probably somewhere in the middle of these two... they don't offer the puncture resistance of a Gatorskin, nor do they offer the speed of a GP4000s.  Depending on their actual performance, you may see half of the time savings above... which would still be comparable to the full aero accessory package.  But what about wear and puncture resistance of racing tires?  Everyone may have different results depending on the riding you do.  I personally had a lot of pinch flats when I rode Michelin Pro Race 3 tires, but have been riding GP4000s for over 3 years and haven't had one.  Your mileage may vary.

Want to compare some of the popular tires out there?  This site does a great job of testing tires and showing how much energy they consume.  The results are "per tire" so you need to double them for a set of tires.

Before running off any buying new tires, there are a few more important things to understand about tires:

  • It is important to have the proper pressure in your tires.  Your tire pressure is determined by the weight you put on the tires (bike + body weight + water bottles + etc.).  This article does a fantastic job of explaining that ideally your tire will have a "15% drop" when optimally inflated, and has charts to demonstrate weight versus pressure with varying tire size.  If you want the "easy button", here is a calculator that will figure out how much pressure you need based on your weight.  For most triathlon bikes, you can use a 45/55 split of weight for front/rear (used the second calculator from the top... and don't forget to add your bike weight).  I suspect that many heavier riders fail to use a larger enough tire (25mm rear) and many light riders tend to add more pressure than necessary (particularly in the front tire).
  • Higher pressure isn't necessarily better.  On smooth surfaces, higher pressures result in lower rolling resistance... this has been demonstrated in multiple tests and can be seen in the rolling resistance testing site I referred to earlier.  But the real world isn't smooth like a stainless steel roller.  And there are diminishing returns... going above 100 psi provides very little improvement in rolling resistance.  In the real world, when you go over bumps there are "suspension losses" meaning some of the energy that is supposed to be pushing you forward instead pushes you upward as you go over bumps.  Excess inflation makes for very bumpy and jittery rides, particularly on a Tri bike where your elbows are resting firmly on elbow pads with no suspension from your wrists.  Way too many people put excess pressure in their tires on race day, assuming it will make them faster... when it could actually make them slower.  I noticed a significant improvement in both ride quality and control when I lowered my front tire to around 90 psi, based on the weight recommendations.  Here is a great article on suspension loss, where these people actually compared riding on the road versus rumble strips to see the impact on power loss.  Not surprising... there was a huge difference. 
  • Wider tires have less rolling resistance than narrower tires.  Again this can be seen on the testing on rolling resistance curves.  Does that mean you should get the biggest tires possible?  No, go with what fits in terms of pressure, under the first point above.  Wider tires can potentially have higher aerodynamic losses than narrow tires.  Most wheels made since 2014 are wider, making 23mm tires effectively 25mm wide which helps with rolling resistance and aerodynamics (the tires end up being flush with the wheels reducing turbulence and improving cross wind performance).  The important point is that if your weight dictates that your need wider tires, they will actually be faster than narrow tires for you.  There is also the option of mixing sizes, such as 23mm front and 25mm rear to optimize rolling resistance based on weight, while getting the benefit of having the rear tire tucked behind the frame on a Tri bike.  Note that you do need to verify that a wider tire will fit in the rear with your frame.  For some Tri bikes the frame is so close to the tire that you could potentially end up with tire rub with larger tires.
  • Not all tubes are created equal.  Because of additional elasticity, latex tubes have lower rolling resistance than standard butyl tubes.  The downside is they are more expensive, lose air faster and they need to be installed with some talc powder to avoid having them stick to the tire and pop (I've blown a couple when I didn't use talc powder on the first inflation).  But there are additional upsides as well.  Besides having lower rolling resistance, latex tubes are very light weight, and some people feel that they have better flat resistance and have a smoother ride.  My own personal experience is that bumps seem to be a little less "sharp" on latex.  The other option is to consider using a lighter weight butyl racing tube rather than latex.  They are between standard tubes and latex in terms of price and performance, but may not offer as good of flat protection.  Light butyl tubes are available in 650 tires, and I've yet to find latex in the smaller tire size.   Here is a test result showing the differences between standard butyl tubes, light butyl tubes (racing), latex and tubeless tires.  

So... something as simple as bike tires do matter.  And it's a relatively inexpensive and easy way to improve your bike speed.

Notes:

  1. It's also important to understand that although bike tires trump aero in this example, that may not always be the case.  In optimized body positions, top age groupers are typically in the 0.24 to 0.27 CdA range and are traveling at higher speeds where aerodynamics starts being a much larger portion of total bike power. 


Cycling... what does that extra 5% in speed really cost you?

For most triathlons, you spend the majority of your time on the bike.  If you want to be a faster triathlete, it makes sense to optimize your bike speed.  So if you are doing long course races (70.3 to 140.6), this means that you can cut substantial time off your total race by maximizing your bike speed… right?

The short answer is yes & no.  Yes, you can have a good bike split, but it may result in a really poor run… more than negating the gains you made by riding fast.  Here's why:  The physiological cost of increasing your speed is not linear.  In the following example for a full IM, a 5% increase in bike speed will "cost" you more than 21% in additional total physiological stress on your body.

Let's play with some numbers:

  • If I average 18 mph on the bike for 112 miles, my total ride time would be 112 miles / 18 mph = 6.22 hours (6:13).
  • If I can squeeze out 5% more speed, my average speed would be 1.05 x 18 = 18.9 mph.  Getting an additional 0.9 mph can't be too hard, can it?  At 18.9 mph, my total ride time would be 112 miles / 18.9 mph = 5.93 hours (5:56).  Basically 5% more speed translates to a 5% time savings, or nearly 17 minutes on a 112 mile ride.  That is a big savings.

Of course… there's a cost of going faster.  And, as mentioned above, the relationships are not linear.

Power is not linear with speed, due to the increasing aerodynamic drag.

Power is not linear with speed, due to the increasing aerodynamic drag.

First, a brief background on bike power.  Whether you train with a power meter or not, it is important to understand the basics of bike power.  The total amount of power it takes to achieve a given speed is a function of aerodynamic drag, rolling resistance, transmission losses (chain/gear friction) and the effects of gravity if you are on a hill.  What is important to understand is that while the impact of gravity and rolling resistance is a linear relationship, changes in speed impacts the aerodynamic power component as a cubed function.  Unless you are climbing or cruising at less than 10 mph, this means that changes in speed require a much greater corresponding change in power.  For example, using the speeds above and an online speed / power calculator, the resulting power is:

  • At 18 mph (see note 1 below for model / input), the required watts on a flat road is 116.51.
  • At 18.9 mph (same input conditions), the required watts on a flat road is 131.93.
  • The increase in power required is 131.93/116.51 - 1 = 13.23%.  So to go 5% faster… you need to produce 13.23% more power (physical work).

But, that isn't really the end of the story, as you also need to consider the impact of this increase in power on your body.  A common factor used to quantify the total physiological impact of a workout on the body is Training Stress Score (TSS).  Essentially it combines the intensity of the workout (Intensity Factory - IF) and duration, to come up with a single factor of how hard you worked your body in the workout or race (see note 2 below).  TSS is calculated by:

TSS = IF x IF x Duration (hrs) x 100

The Intensity Factor is simply how hard your average output is versus what your maximum output is for a 1 hour period.  So, if you could produce 185 watts for 1 hour at maximum capacity, your IF for a ride at 116.51 watts would be:  116.51/185 =0.63.  At 131.93 watts (second scenario), your IF would be:  131.93/185 = 0.71.  Using these to calculate Total Stress Scores:

  • TSS for 18 mph = IF x IF x Duration x 100 = 0.63 x 0.63 x 6.22 hrs x 100 = 246.9
  • TSS for 18.9 mph = 0.71 x 0.71 x 5.93 hrs x 100 = 298.9
  • The resulting increase in physiological stress:  298.9 / 246.9 - 1 = 21.1% increase.

So the question is:  Is the 5% bike speed increase is worth the 21.1% increase stress on your body?  As a rule of thumb, the upper limit of TSS scores during an IM is around 280 for a strong IM athlete and an upper limit of 260 for weaker runner or novice IM athletes.  Few pro's push to 299 TSS values, so likely the 5% increase above would likely result in a poor IM run overall (see note 3 below for more information).

Ideally, you balance your pacing to get close to the target TSS values without going over and resulting in a significant negative impacting your run… meaning your run turns into a long and leisurely stroll.  I'll discuss strategies for this in a future article.

In the interim, train smarter not harder.

Notes:

  1. Calculator example.  I used 165 lbs for the rider, 20 lbs for the bike, CdA of 0.271, CRR of 0.004, Rho 0.076537, 3% drive loss, with no incline (these are similar to my numbers).  There are several similar calculators online, converting speed to power or power to speed.  Note these models assume constant speed, and don't factor in acceleration.  With hills, turns, stop/starts, your average speed versus average watts will be quite a bit different than you will see in these models (higher average wattages for lower speeds).  They are still useful tools at comparing scenarios, if used properly.  Other bike power/speed calculators I use are here and here.
  2. Note that universally a 5% increase does not exactly represent a 21.1% increase in physical "cost" across the board, as it is a function of your specific IF factors as well as the starting point (speed) you are referencing.  If you were comparing 20 to 21 mph, your "cost" would actually be higher than this (due to the increased aerodynamic drag) and it would be lower if you were comparing 15 to 15.75 mph.  The math stays the same, as does the general trend… increasing your speed 5% takes a much larger toll on you body.
  3. Definition of NP, IF, TSS (TrainingPeaks).
  4. Joe Friel IM Bike Pacing blog (TrainingPeaks).
  5. One caveat to Joe's site above and my comments on Ironman TSS values, is that if you look at the pro women, they seem to run higher TSS values than the guys (overall) and do push into the 300 range.  Here is a list of files for 2013 and 2012 for reference.  Two top age group female athletes have shared IM files with me, and I have noticed that they also seem to be able to push higher TSS values and still run well, making me wonder if women are able to hold higher biking IF values for longer duration than men.